JA:Party render
はじめに
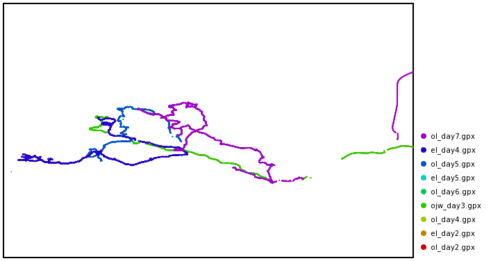
マッピングパーティの後の夕方、全てのトラックログを取得し終えた後、たいていの場合、さらに一つ、行うべき儀式が待っています。 次のようなものです。
- すべての30ものGPXファイルを JOSMで開く。
- 最初のGPXファイルを選択し、それに色を付ける。
- 他のGPXファイルには別の色をつける。できるだけ他の色を使う。
- 広報やWikiのために、スクリーンショットを取る。
その結果、次のような画像を得るわけです。
素朴な疑問: これを自動化しないの?
コード
Source code is in Python, and located in SVN with history
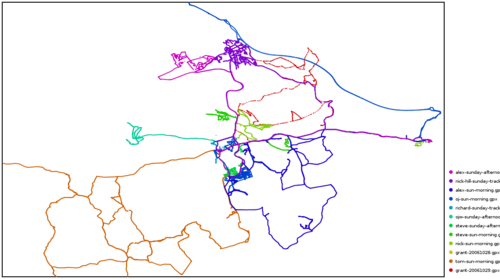
Sample output:
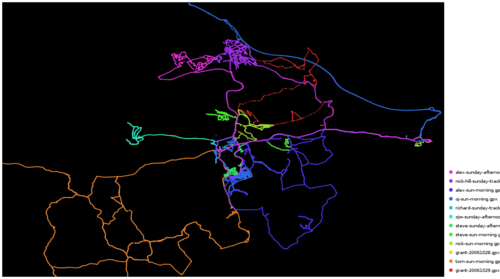
Black background:
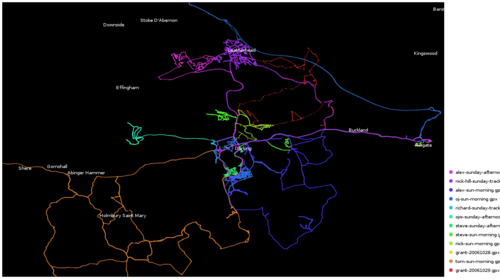
With town locations (can be downloaded, or from a file):
Options
- -d Directory to scan for GPX files
- Will be scanned recursively
- Files ending in ".gpx" only
- -s Image size (pixels)
- Actual image width will be larger, to accommodate the key
- -p Size of each dot
- Seems to be in mm for some reason. 1 is normal
- -r Radius of map in kilometres
- -g Gazeteer filename
- Location of an OSM file containing city/town/village nodes
- Use "osmxapi" to download it from the internet (default)
- Use "none" to prevent displaying cities
- --pos=lat,lon Centre of the map
- Available on the animated version only
- If not supplied, will centre on the mean average of your trackpoints
Run python render.py --help to get the command-line names for those
Structure
- SAX used for parsing GPX files
- Cairo is used for drawing
- Data is stored as a hash of files
- each containing a list of trackpoints
- each of which is a tuple of (lat,lon) in degrees
- each containing a list of trackpoints
- width is the width of the map itself - the actual image is fullwidth and includes the key
- Y values start from 0 at the top and increase downwards
Maths
Naively, you might think you could take the extents of the trackpoints and use those to scale the map. Doesn't work - nearly everyone has erroneous points from middle of the atlantic, or from their home town 100 miles away.
Theoretically, the best algorithm to scale the map would be Median absolute deviation, since you can ask it for the middle 90% (say) of points and ignore outliers completely. However, I've had some trouble getting MAD to work on 200,000+ points (The O(n) algorithm uses quicksort and uses too much memory/recursion depth. Other algorithms are just very slow)
- There is a suggestion to use MAD on a subset of the points, e.g. every 1/1000 points. Ojw 17:35, 14 October 2007 (BST)
(note: on my tests, the "real map" only covers about 0.1 standard deviations, so SD doesn't look like a very good measure either)
So the current version just asks for how many kilometres you want, and centres the map on the average (mean) position of trackpoints. But we should try and find a better way of doing it from the tracklogs themselves.
Animated version
needed libraries
- pymedia.video.vcodec python library
- pygame library as pymedia prerequisite
Example output as MPEG or on YouTube
if the code in the SVN is not working try this one


