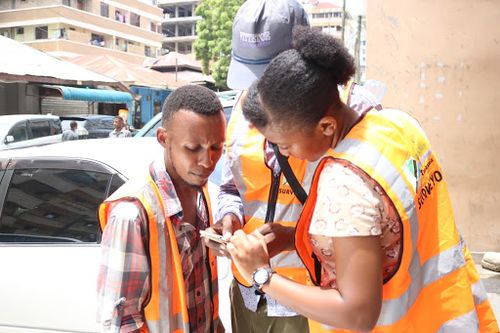
METEOR Project in Tanzania
METEOR Project in Tanzania
Project Overview
Modeling Exposure Through Earth Observation Routines (METEOR), is a three-year project funded by the UK Space Agency to develop an innovative application of Earth Observation (EO) technologies that will improve the understanding of disaster exposure. The project focuses on two pilot countries━Nepal and Tanzania. METEOR involves eight consortium organizations from across four continents. Their expertise spans from humanitarian aid to remote sensing and disaster risk reduct,iand to policy advice.
Under this project, Humanitarian OpenStreetMap Team (HOT)--wi— Tanzanian local partner OpenMap Development Tanzania (OMDTZ)━was—tasked to ewithcute thing project in Tanzania. During the period of December 2018 through May 2019, HOT and OMDTZ digitized a total of 10,955 buildings on himogenous zones using the Tasking Manager to create data sets aiming to build local and global resilience through innovation in order to better identify risk and enable more effective decision-making and deliver a country-wide openly-available exposure data for the 48 least developed Official Development Assistance (ODA) countries.
Goals and Deliverable
- Deliver exposure data for 46 of the least developed ODA countries
- Create open protocols to develop critical exposure information from EO data
- Capacity-building of local decision makers to apply data and assess hazard exposure.
Mapping Timeline
The project began from 22nd October 2018 to 30th April 2019. Several activities were conducted during this timeline including: remote mapping of buildings, building attribute data collection, field data validation, verification and upload of data to the OpenStreetMap (OSM) platform.
Area of Interest
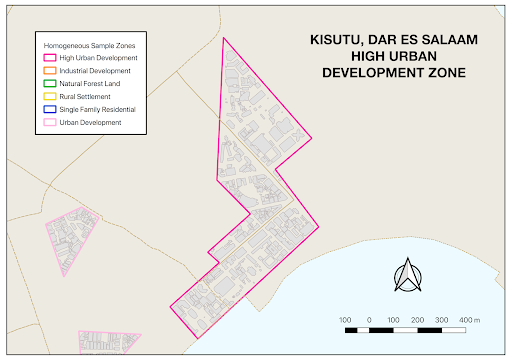
The digitized buildings were subsequently used to conduct building exposure surveys of Dar es Salaam and the neighboring region of Pwani with seven selected homogenous zones categorized as:
- High urban development zone
- Industrial zone
- Urban development zone
- Single-family residential zone
- Rural settlement
- Natural forest land, and
- Informal settlement zone
The zones mentioned above fall within 35 wards of Dar es Salaam as shown on the map below;
Remote Digitization
Mapping Approach
Remote mapping, also referred to as armchair mapping, is the process of modifying and/or adding in new data to areas from a distance. It usually involves the use of a software program, tracing information using satellite imagery, and uploading the results so they can form part of a map data. Using imagery to draw points, lines and shapes on the ground can also be referred to as building digitization.
As a pre-field activity, building datasets is crucial as it supports the data collection process once field survey is to be conducted. Although most parts of Dar es Salaam were already digitized using either Bing or DigitalGlobe aerial imageries, there was a need to update and re-digitize most of the misaligned buildings using high-resolution imagery. This is an important process as it determines the level of quality of data to be collected in the field.
This section provides in-depth information on different mapping activities conducted in the duration of the METEOR project—and while on that, the subsections dive deep into more details of mapping approach, tools used for mapping, quality assurance, challenges faced, etc.
Methodology
This subsection dives deep into the mapping methodology and how user-friendly tools were used to directly make changes to OpenStreetMap, the free collaborative map of the world. This is as follows:
Tasking Manager Projects
The HOT Tasking Manager is an OSM tool to manage, create and open tasks to help mappers add features easily. The HOT Tasking Manager plays a vital role to help monitor mappers contributing to OSM by gridding out areas for mapping. This allows a user to work on one task at a time and reduces the chances of creating data conflicts.
- In this project, the tasks were created from homogenous zones sampled in different areas such as planned, unplanned, scattered and less populated areas. Using QGIS software, homogenous zones were split into multiple polygons for task creation in GeoJSON format. The GeoJSON created for the multiple polygons was used to create an Area of Interest (AoI) in the tasking manager for projects.
- Since there were many AoIs and some were too small━nearly 31 portions, these AoIs were combined to get bigger portions to create tasks to ease the process and reduce the number of projects created in the Tasking Manager.
- To ease the process of tasks searching on the Tasking Manager the word “METEOR” was used as a project hashtag.
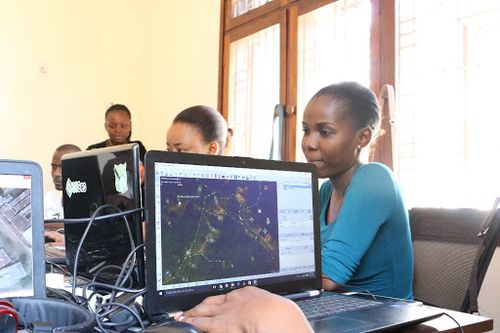
- Right after the creation of the Tasking Manager’s areas for mapping, a team of 24 mappers started tracing buildings with instructions and close supervision. The guiding instructions were indicated on the Tasking Manager, while the supervisors stayed close to assist the team with any challenges.
- Some parts of these areas were already mapped and had data while others were not mapped. The mapping team was instructed not to delete existing buildings but encouraged to edit and modify features that needed correction before uploading to OSM.

List of Tasks Mapped from HOT Tasking Manager
- https://tasks.hotosm.org/project/5398)
- https://tasks.hotosm.org/project/5862
- https://tasks.hotosm.org/project/5882
- https://tasks.hotosm.org/project/5860
- https://tasks.hotosm.org/project/5405
- https://tasks.hotosm.org/project/5395
- https://tasks.hotosm.org/project/5397
- https://tasks.hotosm.org/project/5394
- https://tasks.hotosm.org/project/5396
- https://tasks.hotosm.org/project/5392
- https://tasks.hotosm.org/project/5391
- https://tasks.hotosm.org/project/5390
- https://tasks.hotosm.org/project/5389
- https://tasks.hotosm.org/project/5387
- https://tasks.hotosm.org/project/5386
- https://tasks.hotosm.org/project/5370
JOSM Application
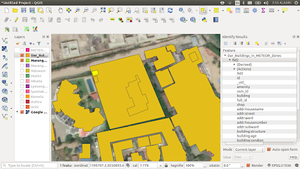
The team used Java OpenStreetMap Editor (JOSM) to trace buildings and for initial quality checks before uploading data on OSM. Tracing buildings was easier because a high 10 cm COWI resolution imagery provided by the Ministry of Lands, Housing and Human Settlements was used. Throughout this activity, the mapping team was able to trace and fix existing errors of 9038 buildings in all zones.
| From QGIS | |||
| Homogenous Zones | Building Count | ||
| Before | After | Difference | |
| 1 High Urban Development (HURBAN) | 331 | 443 | 112 |
| 2 Industrial Development | 418 | 489 | 71 |
| 3 Natural Forest Land | 0 | 0 | 0 |
| 4 Rural Settlement | 790 | 1767 | 977 |
| 5 Single Family Residential (SFR) | 3939 | 4923 | 988 |
| 6 Informal zone | 3287 | 3893 | 606 |
| 7 Urban Development | 1167 | 1416 | 249 |
| Total | 9932 | 12931 | 2999 |
Quality Assurance
To create high-quality data, the validation process needs to be carefully considered. After completion of remote mapping, the mapping team started data quality assurance and data review processes. Data review was conducted in two different ways:
- The first round of validation was done through selecting mapped boxes in tasking manager and opening the box in JOSM to validate if the information mapped is correct. This process which involves editing and modifying features and fixing errors/warnings was done individually through running the JOSM validation panel and activating different filters for simplifying data analysis. Since by using filters you can deal with one feature at a time, here is the link for more information about filtering.
The checkboxes were then marked as validated in the Tasking Manager. Once validation by each individual was done, another validation was done to finalise the whole layer. This involved exporting the GeoJSON file in tasking manager and importing it into JOSM where one can download the whole area and work on it. This was important for data quality, especially for buildings that were found in between two tasking boxes. Sometimes you may find that they are left as they are i.e. not mapped in order to avoid conflicts between boxes therefore this was done by mapping supervisors only.
- The second round of validation was done through QGIS━an open software for data analysis and visualization. We obtained building ID’s from QGIS, made a list of them, and got them fixed in JOSM. The corrected polygons were then re-downloaded and added in QGIS. After this process, 37 buildings were found to have issues with the multi-polygon relation especially in JOSM. This is the benefit of using more than one validation tool to review data.
After the data review process, a few experts from the mapping team were assigned to fix the detected errors in QGIS. All 37 buildings that were found to have multipolygony issues were then re-digitized and tagged correctly using JOSM Editor.
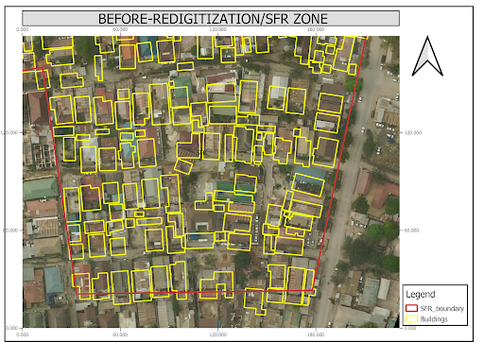
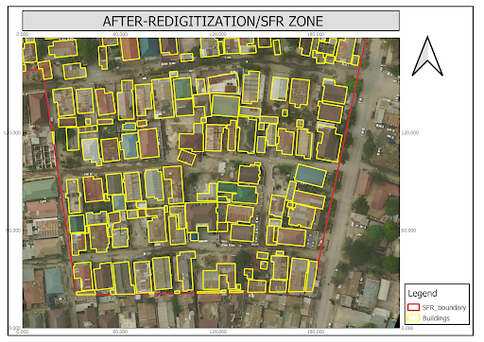
Quality Assurance (Before and After digitization)
Building Alignment
In the previous digitization, different images were used which led to some buildings becoming misaligned to the COWI imagery (Aerial Image provided by COWI company-Tanzania). After digitization with the COWI imagery, all buildings are now well aligned since only one imagery was used.
Building Shape
In the previous digitization, most building shapes were inaccurate due to poor resolution of the imagery used which made shapes of the buildings unclear. With the COWI imagery, buildings can be seen clearly and the shapes of the buildings are clearly defined.
Undigitized Buildings
In the previous digitization, due to poor imagery resolution and the imagery used not being recent, some buildings were missed during digitization and were not digitized. With the COWI imagery, taken as recently as 2016, new buildings that were recently constructed were added as well as the buildings which were missed in the previous digitization.
Quality of image used
| Satellite Imagery Details | |
| Product | COWI |
| Cloud coverage | 0% |
| Off-Nadir | 0 |
| Acquisition Date | 2016 |
| Resolution | 10cm |
List of Contributors
| Team | Role | Name | OSM Username |
| Tanzania | Team Supervisor | Dorica Mugusi | [dorica_mugusi] |
| Tanzania | Editor | Gwantwa Andrew | Gwantwa_Andrew |
| Tanzania | Editor | Dorice Lucas | Dorice lucas |
| Tanzania | Editor | Jamal Amani | JAMAL AMANI |
| Tanzania | Editor | Mariamu Crispo | Mariamu Crispo |
| Tanzania | Editor | Nuru Athumani | NURU ATHUMANI |
| Tanzania | Editor | Samwel Kyando | Samuel Kyando |
| Tanzania | Editor | Frank Charles | charles Frank |
| Tanzania | Editor | Abubakari R Kachongo | abou kachongo jr |
| Tanzania | Editor | Christina Reuben | Christina Reuben |
| Tanzania | Editor | Edger Mahali | Edger |
| Tanzania | Editor | Aron Martin | AronMartin |
| Tanzania | Editor | Erasto Eliud | ERASTO ELIUD |
| Tanzania | Editor | Asibwene kalulunga | asibwene |
| Tanzania | Editor | Godfrey Faustine | Godfrey Faustine |
| Tanzania | Editor | Janeth Mlinga | janeth mlinga |
| Tanzania | Editor | Neema Kombe | catherine godwin |
| Tanzania | Editor | Damon Monyo | Damon Monyo |
| Tanzania | Editor | Furaha Mrema | Furaha L Mrema |
| Tanzania | Editor | Godfrey Hussein | Godfrey Hussein |
| Tanzania | Editor | Neema Alphonce | NeemaAlphonce |
Challenges During Building Digitization
Due to the nature of digitization, there is always a need for a good internet connection when using the Tasking Manager and uploading data to the OpenStreetMap platform. This was somehow challenging because even though the team members were provided with scratch cards to top up their phones and tether their laptops the internet was still down and overloaded
Data Collection
Surveying Approach
This refers to site visiting for ground truthing and collection of relevant data. Field mapping includes adding all necessary tags as stipulated in the data model and making sure the attributes are tagged correctly to avoid any inconveniences during validation and analysis. It may include observation, direct interviews with community members and/or residents etc.
Observation process was the main method used in data collection due to the nature of the data needed. Some specific questions that cannot be answered by observation were asked to the residents, for example the number of people living in the household.
The team had weekly catch-up meetings to share challenges faced during data collection and asked some technical questions concerning data collection tools i.e. OSM layers, OpenDataKit (ODK) Collect and OpenMapKit (OMK), and also talk about the quality of data collected.
Creating Building Samples
The digitized building footprints were used to do randomization of the buildings so as to identify areas for field surveys in later stages. Randomization was done to achieve the following:
- Selection of seven homogenous zones with buildings by random sampling method with the aim of getting 400 buildings from each zone to be surveyed to make a total of 2400 buildings. It was originally supposed to be 2800 buildings but the natural land forest zone was left out of the list as there were no buildings found in the zone.
- There was an addition of 100 buildings to the selected buildings to make a total of 500 buildings in each zone. The reason for this is because we expected that some of the buildings might be inaccessible or restricted for data collection i.e. points falling under military/government complexes where ground survey is prohibited. In this case, possible alternative points were chosen to be mapped to make up for the restricted areas.
Localizing the Data Model
The data model used for this project was adopted from Kathmandu METEOR project and the attributes were built upon GED4ALL. Localization of the data model was done according to the nature of buildings in Tanzania whereas some OSM tags that do not apply in Tanzania were removed and others added with reference to the need.
- Questionnaire forms
In order to localize the data, the questionnaire form was modified to concur with the buildings available in Tanzania. The forms field in the field after data collection are uploaded to the OMK server online. ODK and OMK forms used in data collection are found here.
- Project feature source tag
This refers to the uniqueness of the project when someone wants to filter the data from OSM, therefore source tag was added to each building during data collection in order to differentiate the buildings that were mapped during the METEOR project.
All data uploaded through field survey was applied with a ‘METEOR Dar es Salaam Field Survey 2019’ as a changeset comment and a source tag in order to simplify the filtering of data.
Summary of the Data Model
| Title | OSM key | OSM description |
| The material of the lateral load resisting system | building:lateral:material=* | Proposed lateral material tags
|
| Lateral load resisting system | building:lateral:system=* | Identified resisting systems tags
|
| Height | building:levels=* | Number of above ground level of a building |
| building:levels:underground | Describe the number of level of building below the ground | |
| Date of construction | building:age=* | Proposed tags for age of construction
|
| building:condition=* | Describe the condition of the building
| |
| Occupancy | building=* | Describe the building purpose
|
| capacity:persons=* | Describe the number of people a building can support | |
| Roof | roof:shape=* | Well known roof shape
|
| roof:material=* | Outer material of the building roof
| |
| Neighbouring condition | building:neighbor=* | Describe the neighbouring condition of the building
|
| Geological site condition | building:geological_site=* | Illustrate the geological site condition the building built upon
|
Pre-Field Work
- Recruiting the field mapping team was done with reference to the experience of data collectors in the previous community mapping projects. Most of the recruited people had a background in Urban Planning studies where GIS and mapping is part of their curriculum.
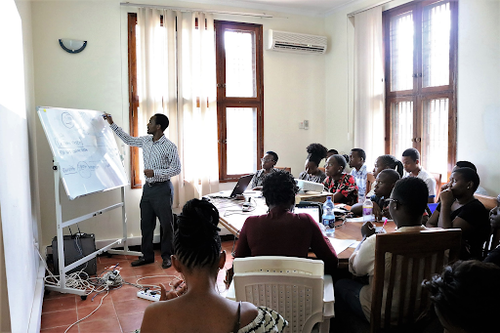
- The recruited team was trained on how to describe building details according to the developed data model. This was conducted by a structural engineering lecturer from Ardhi University. Training materials are uploaded here.
- Further training on software for data collection was provided by the mapping supervisors. The training based on ODK and OMK━smartphone applications for surveying and data collection. With the advantage that most of the data collectors were engaged in previous community mapping projects like Ramani Huria, it was easier to go through with these trainings.
- Configuring the OpenMapKit server and downloading the survey.
- Splitting sampled buildings according to zones and save them in osm file format and added them in as OSM layers in OMK for mapping.
- Drone imagery with high resolution converted to mbtiles was also added in the OMK files. The imagery helps in geo-locating a mapper in the field and knowing the exact building to be surveyed. Maps.Me was also used to navigate around in the field.
- Before data collection started, two staff members went to 6 municipalities, 5 in Dar es Salaam and one municipal council in Pwani to seek for permission to conduct field survey. The letters were also distributed to wards and subwards and leaders were notified of the mapping activity that was to be conducted. This process is very important as it has posed problems to the teams before when permissions are not given for any field activities.
Map Campaigner
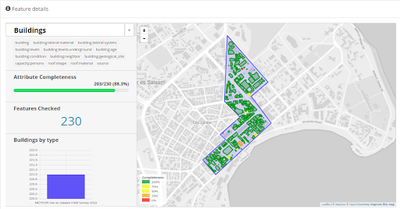
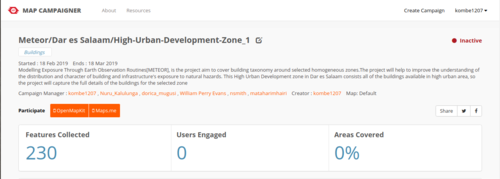
Map Campaigner━a monitoring tool created to manage field activities to check and review the status of the ongoing and completed field mapping campaigns. Since the zones were scattered, the campaigns were created following priority of the zones. The following are some of the map campaigns created to check the completeness of attributes collected in the field after the data was uploaded to OSM:
Map campaigns created to check the completeness of attributes collected in the field after the data was uploaded to OSM:
- Meteor/Dar es Salaam/Urban-Development: https://campaigns.hotosm.org/campaign/203467dc917f4f39ad25cace439555b3
- Meteor/Dar es Salaam/Industrial-Development-Zone_2: https://campaigns.hotosm.org/campaign/6e03da6b7af54bf48d44d5adb0ddc17e
- Meteor/Dar es Salaam/High-Urban-Development-Zone_3: https://campaigns.hotosm.org/campaign/ce18d14f52ba45b8a96d0a2e4a11fb27
- Meteor/Dar es Salaam/Urban-Development-mixed: https://campaigns.hotosm.org/campaign/ab1e11ac372a4a418e3b78e7b568d61c
- Meteor/Dar es Salaam/Urban-Development-Zone-1: https://campaigns.hotosm.org/campaign/473705af7e88403986bd910ab5694b29
- Meteor/Dar es Salaam/Industrial-Development-Zone: https://campaigns.hotosm.org/campaign/d0ad90f2a7504cbf9d91453080336093
- Meteor/Dar es Salaam/Rural-Settlement: https://campaigns.hotosm.org/campaign/9323035dde544c868793a92844b37c53
- Meteor/Dar es Salaam/High-Urban-Development-Zone_4: https://campaigns.hotosm.org/campaign/35bb6252b9e948ffa53c04a5445c2ef8
- Meteor/Dar es Salaam/Single-Family-Residential: https://campaigns.hotosm.org/campaign/90c4cc568a5a47d49db343a08d658d1e
- Meteor/Dar es Salaam/Informal-zone: https://campaigns.hotosm.org/campaign/7316fb4466ce4393879ab9501556c9c1
Results
At the end of the field work, a total of 2951 buildings were surveyed. Some of these buildings had pre-existing attribute information following the tags identified from the data model such as building, building:age, building:levels, and building:material while other tags were not present at all.
The table below shows how the information uploaded through this project has added the tags as outlined in the data model:
| Tags | Before | After |
| building | 1548 | 2951 |
| building:age | 206 | 2951 |
| building:condition | 105 | 2951 |
| building:lateral:material | 0 | 2951 |
| building:lateral:system | 0 | 2951 |
| building:levels:underground | 0 | 2951 |
| building :levels | 1461 | 2951 |
| building:neighbor | 0 | 2951 |
| capacity:persons | 0 | 2951 |
| building:geological_site | 0 | 2951 |
| roof:shape | 0 | 2951 |
| roof:material | 222 | 2951 |
| source | 0 | 2951 |
Summary of Building Data Collected
| Homogenous zones | Buildings count |
| High urban | 584 |
| Urban development | 505 |
| Industrial | 423 |
| Single-family residential | 467 |
| Rural settlement | 434 |
| Informal settlement | 538 |
| Total buildings | 2951 |
Note: No work has been done on natural forest zone--There were no buildings
After data collection, the data was then cleaned by using JOSM and uploaded onto OpenStreetMap. We were able to clean and upload 2951 building polygons on OSM using the changeset comment and source tag source: METEOR Dar es Salaam Field Survey 2019. We calculated the number of buildings in each zone and found out that some zones have more or less buildings than others.
Data Validation
After data collection, we recruited another team for data validation from Ardhi University━4th year students majoring in Bachelor of Science in Building Economics. These validators were specifically identified by the hired engineer who trained our team before fieldwork.
The main aim was re-checking the tagging of buildings and it was only done on the priority areas i.e. high urban, urban and industrial zones. These are zones with high rising buildings and some of them with complicated structure and materials. We chose to validate only some zones since they contain high rise buildings that need more time to describe the features. The validation was done in a timely fashion. Validators did the following:
- Physically visiting the field and identifying and ensuring data was collected on the sampled buildings.
- Describing building lateral materials used in a particular building. Detailed identification of lateral systems and making them clear to the team in case of any confusion.
- Describing the nature of roofing materials used and the roof shape and giving out comments in case the material and shape of the building are not portrayed in the form.
- Giving out general comments depending on the validators’ experience in case they find features and materials that may not easily be understood by the team (data collectors).
Sustainability Plan
- OpenMap Development Tanzania━a local entity that leads OSM community in Tanzania, will continue to manage and update the data in Tanzania beyond the project period as all the surveyors were trained about basic mapping that could help to update data in the near future.
- All data collected will be used by ImageCat━an international risk management innovation company supporting the global risk and catastrophe management needs of the insurance industry, governments and NGOs━to develop a disaster model.
For us, data collection is completed in the prioritized zones. We are looking forward to seeing whether this has to be done to other remaining parts in Dar es Salaam and/or other regions. This will depend on the demand of the model that will be developed.
Contacts Details
You can contact the team through:
- user:[osmuser:William Perry Evans] Tanzania Country Manager, user:[osmuser: kombe1207] Technical Mapping supervisor
- Other mappers active in this project are; user:Pascal Mapera, user:Zainah, user:Mwaisaka, user:Neemaelias, user:Joan Kamwela
- Project Manager from HOT's side User:[osmuser:mataharimhairi]
