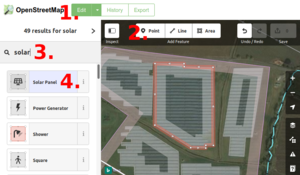
UK 2019 Q3 Project: Solar Power
The aim of this UK Quarterly Project is to map all things solar power related.
This project runs for July, August, and September 2019.
NEWS: as of 25th August 2019, we've now mapped over 75,000 standalone solar PV items in the UK, plus over 500 solar farms! This is great work. Can we get to 100,000?
Why
There are approx 800,000 rooftop solar PV installations in Britain, and together they provide around half of the country's solar capacity. If we can map them, at least their latitude and longitude, this information can be useful for tasks such as predicting how much solar energy we'll get on a particular day, or searching for new suitable rooftops for future installations.
"As solar cannot be controlled, it affects the balance of supply and demand in the electricity grid. Uncertainty in forecasting PV results in the need for standby generators to provide additional reserve capacity, making it more expensive to manage the grid, but with accurate forecasts the amount of reserve can be reduced, cutting costs for National Grid and so the bill payers."[1]
"Because all solar is connected to the distribution networks, historically National Grid, as the System Operator, has no visibility of live metering from solar generation. This has meant that accurately forecasting demand has proved challenging. With installed solar PV capacity increasing since 2011, it has become an important component in our demand forecast." - Summer Outlook Report 2018, National Grid
How to tag

See generator:source=solar. Note that the larger solar farms are not all consistently mapped: some are mapped as just a single "generator", not as a "plant" as described in the wiki page.
For more on tagging rooftop solar, see Renewable_energy_in_the_United_Kingdom/Rooftop_Solar_PV.
To watch how to survey(using OsmAnd) and how to map(using iD) these solar panels, Mapper Diaries has an extended-length video. that also talks about why we map them.
Suggested processes
Solar farms and smaller rooftop installations are quite different (e.g. in quantity, or in how easy they are to see in imagery). Do we want a single approach, or to approach the two separately?
Data sources
The Department for Business, Energy and Industrial Strategy (BEIS....that used to be DEFRA) Renewable Energy Planning Database (REPD) is a collection of planning information for larger scale (generating 1MW+) renewable energy sites in the UK. The data is provided every quarter as a csv or Excel extract or via a WMS kml feed -- and in the OSM wiki there is (taken from REPD) a table of under construction and operational UK ground mounted solar farms, in Renewable energy in the United Kingdom aka solar farms sited in fields.
Renewable Obligation register (has site addresses and MW) - needs more info or a link to data
The Feed in Tariff register (admin region for smaller installations)
Tools
- Gregory Williams completeness list (by Local Authority, then by LLSOA) comparing OSM to FIT register.
- TagInfo stats showing the number of solar sites mapped.
- pywind python library
- [1] UK planning scraper in ruby
- Open Infrastructure Map is a map made from OSM data which shows solar power up well - you'll need to turn on the "solar" layer.
- The iD edit has presets like https://github.com/openstreetmap/iD/blob/master/data/presets/presets/power/generator/method/photovoltaic.json these could be checked.
- Solar panels added to OSM - to visually check the amount added in the UK (by postcode district).
- Renewable energy in the United Kingdom#List of under construction and operational UK Ground Mounted Solar Farms - source of adding solar farms (if they've since been built or visible where they are).
Analysis of progress
See "Tools" above for e.g. the solar "completeness list". Also: some numerical analysis of the UK solar data here by User:Danstowell.
Previous projects
A lot of work has been done on onshore wind in Renewable energy in the United Kingdom and the energy grid in general for the Open Infrastructure Map
