User:Ojw/sotm11
In Vienna. Previous: Girona. Next: TBA
2011 conference was State Of The Map Europe 2011. (not State Of The Map 2011 which is a similarly-named conference in the USA)
206 people from 25 countries [citation needed]
Startup
Bing imagery is apparently available/licensed/encouraged for general mobile-app use. Suggested more easy-contribution idea like front door.
Social networks like Twitter not much used, rweait suggests rota of people to reply to @openstreetmap messages.
→ Twitter bot?
OWL can do watchlist notifications
http://map.umt.edu/ showing road junction/pedestrian crossing layouts and deriving road centrelines from that. (but we know the real centrelines at junctions, and they can differ from centre of road area, so probably need to map anyway like we do with river centrelines)
Ordnance Survey hackday shows cultural ideas spreading into unexpected groups. (as does ESRI OSM presumably)
Maps customised to match corporate websites - not really used much.
→ Easy recolouring of maps without rerender
Bing has a "streetside" view (but probably doesn't work because silverlight)
http://soc.org.uk/neocartography
Stuff expat aid-workers like
OCHA (UN website)
AIFDR where DR is disaster reduction, i.e. pre-mapping risky areas so that data is available immediately if something goes bad
MapAction (GIS users)
http://publiclaboratory.org/ (don't mistype that one!)
Use of kites and ballons. OpenAerialMap
"Tasking server" to coordinate intensive mapping where people can "lock" or reserve areas of the map that they're editing. (aside: Maybe useful for organising mapping parties which have similar "cake diagrams")
Names of roads get done by expats for Haiti. (but this never got done in Baghdad, right?)
MS
Spending $200M on maps, prioritising areas by population. Need 100km×100km area cloud-free to do all at once. Aiming for $20/km² cost.
Declared their idea of workshare as "Bing does images, OSM does vectors", presumably then using OSM vectors as their map.
Usability
GMM has standard process of
- Select mode
- Draw
- Edit extended attributes
which is more consistant than the potlatch way of drawing
P2 is about halfway down the line in discoverability-power continuum
Seafahrers and Nauticals
Worldwide consistant coverage needed, as sailors travel a lot
IHO standard for charts
1:1 correspondance mapping OSM tags to IHO tags, allows OSM data to be loaded onto existing chart-readers.
Symbols better than text in editor-dialogs, because of i18n. Symbols in editor need to match symbols in chart.
Got 500m resolution dataset for depths by special agreement with (who?). But only for areas with depths > 20m, so need littoral areas to be mapped by crowdsourcing
Wants either plugin to existing GPS & depth-sounders carried on boats, or new cheap gadget (from hardware hacking community) that can log depths. Wants much better position accuracy than GPS modules are claiming.
Ivory towers
Research wiki page - academics want ideas for things to research
~10 papers saying OSM is accurate
Causes "questioning of long-held views" regarding top-down processes and ontologies
VGI ≠ OSM (i.e. can't apply conclusions from OSM to GMM, GeoNames, WikiMapia etc, or v-v)
Potlatch
Halycon library
Allows choosing a map style. AA wants more stylesheets to display here
Can load various formats of vector file
Custom editors on other websites. e.g. http://wanderreitkarte.de/ and MapQuest Open
Kite mapping
http://wiki.grassrootsmapping.org/
Mapnik Metawriters
Exports data file saying what was written to image, e.g. bounding-boxes for text, or lines and points (for HTML imagemaps)
http://r2d2.stefanm.com/mapnik/demo2.html
Another similar project is grid renderer, which exports per-pixel metadata about Mapnik images
My thoughts: Would be nice if Mapnik could read its own metadata output, so a base-layer renderer generates list of rectangles where it has placed text, and a set of overlay renderers try to arrange features into positions that don't conflict with the basemap.
Maperitive (was Kosmos)
Now runs on Mono/Ubuntu! :)
Can display image-tile underlays. Loads osm.bz2. Can load custom DEM files. Rendering from database is too slow for interactive mode, so load all daa to memory.
Collada 3D → Sketchup
RaphaelJS (is this similar to JSON export?)
Osmium (JoTo's planet parser)
Data-storage objects look useful for general-purpose OSM storage
Built-in handlers are:
- statistics
- node positions (copies lat/lon from nodes to way.nd)
- multipolygon (unwinds the various weird types of polygon used in OSM, with some error-fixing)
Uses mmap (big data) or sparsetable (small data) for temporary storage
Header-only library, so dependancies are only used if used.
Can embed the Google G8 javascript engine, to allow writing callbacks in JS
KTHML (javascript slippy-map)
3 lines JS to init. Map.featureCollection is where to add stuff.
Requires scrollwheel or iPhone to zoom, doesn't work on Android
Extensive use of GeoJSON
To make lines into areas, set classname.baseval="polygon"
Move around with map.animatedGoto()
Can drag markers around in the map and then get their lat/lon from javascript
KHTML can do multipolygons!
OSM parser
No popups yet (GSoC planned)
Augmented reality
Height data is v.important.
Quality of solution depends on GPS position for nearby objects, and on compass for far objects.
Other researchers say that phone compass isn't good enough for use in AR
Photos → 3D models
http://code.google.com/p/osm-bundler was considered too difficult to use, got replaced
Sketchup OSM plugin allows drawing with sketchup then saving as OSM file
OpenStreetBrowser
Allows clicking on objects in OSM data and getting full pages of textual information, e.g. wikipedia
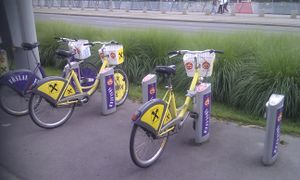
OT: Citybike
€1 per trip. Backpedal to brake.
- 25 minutes Treitlstrasse to Frankhplatz
- 18 minutes Alser Strasse/Feldgasse to Treitlstrasse
- 17 minutes Treitlstrasse to Frankhplatz
- 14 minutes Sigmund Freud Park to Treitlstrasse
- 19 minutes Stephansplatz to Treitlstrasse
Railways
OSM data is too detailed to get railway networks - need simplified routes linking stations (like we do for river centrelines). But doesn't want to just put this in OSM in case people edit ("the node would be in middle of nowhere with no apparent reason to exist")
"Heartline" term defined
Good plot of angle vs distance for OSM nodes in a way - clearly shows straight/curve sections, with "noise" due to precise node positioning. Simplifying that graph and integrating back to get positions allows creating long sections which approximately match the route. (100m worst case)
Aside: bridges cause railways to shift sideways, as bridge is built first, then existing railway rerouted over new bridge
Wheelchairs
Wheelchair map has list of 40K points accessible=yes/no/maybe that they would like to use in OSM but without import.
My idea: generate tilemap with red/green blobs that Potlatch users can look at while mapping, to see if the feature they're editing should have a wheelchair tag.
Idea to put OSM data into Google maps. Apparently new license will allow it (so we don't get much say, surely - why bother voting?)
3D globe
Talk started early - need to watch video :(
openwebglobe.js - javascript globe ion WebGL canvas. Billboards that can display HTML.
Compiled using "closure" compiler for javascript (where you have to static-type objects) but still 10x slower than the C version
TagWatch
Quote: "we could get rid of half of all tags without even thiking about it" (i.e. misspelled ones)
Creates useful reports, e.g. undocumented tags
Has an API! :)
More data sources needed. Currently it takes Planet, Wiki, and Renderer configs (and OpenStreetBrowser offered their data).
Would be good to use TagWatch as editor plugin, e.g. "this tag isn't used much, are you sure you didn't misspell it?"
Suggestion to generate road-length statistics, for purposes of comparison with commercial databases. Problem since osmium throws-away lat/lon very early in process to save on temporary-storage.
- Sinatra (ruby web interface)
- jQuery
- protovis
- flexgrid
Van-fleet routing
TODO: locate their academic paper on dividing addresses amongst vehicles with min/max journey length constraints
State-machine for generating instruction-text from route nodes
sourceforge project "OsmSharp" (C#)
Need high-contrast rendering for reading printed maps in early morning (maps for people who didn't get coffee yet?)
Mapnik cartography
Use Buffer(10, Buffer(-10)) in Mapnik SQL statements to simplify buildings
Bus stop areas for label-placement (lots of objects with same name, only need one text label)
Special-variables !bbox! and similar one for zoom, can be useful in tile-generation and getting data from APIs
Discussion on feature placement depending on how dense they are (i.e. automated solution to Proposed features/Pub location)
Correctly zooming to named area
General algorithm is "zoom out until 200,000 population is in view", to give proper balance between urban areas needing high zoom and rural areas lowzoom
SEDAC is the gridded population-density dataset that can be useful in some countries. Arkward to calculate around coastlines.
Used in GroupsNearYou (a CL project)
Project of the week
Project should be like detailed tutorials on mapping a feature step-by-step. Lots of essay-style work.
