Bing Maps/Coverage
Bing imagery covers the globe with varying detail levels. Some of the globe (most ocean, and some remaining landmass) is only available as very low resolution satellite imagery. This is effectively nasa Landsat imagery forming the base-line for any areas where Bing does not have better imagery coverage. The areas where Bing does have better coverage, are what's really of interest. Within these areas we see a variety of available resolution levels, and ages of the imagery.
Coverage analyzer tool

A coverage tool is available which allows you to view and discover areas of bing coverage:
https://ant.dev.openstreetmap.org/bingimageanalyzer/
Interpreting and updating
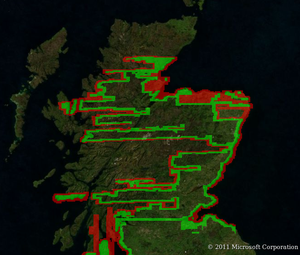
This tool will draw a coverage map. Red is bad (only low-res fuzzy imagery available) Green is good (hi-res imagery available). Other shades of blue are very good (extra hi-res imagery available).
But the map has lots of uncoloured areas. The tool actually fills in these colours when people viewing it at hi zoom levels, so you can help trigger it to fill in a patch, if it is of particular interest. In this way it fills in and updates the colours on an interest-first basis. Clever, but also rather weird and confusing. It's extra confusing because you need to note these awkward quirks of the tool:
- The bing slippy map seems to fail every now and then and refuse to show any colours, perhaps due to tile serving issues when the dev server is busy. You can usually trigger it to refresh and sort itself out, by clicking 'permalink/refresh' in the top right.
- No new red/green status is produced until you go in to zoom level 14 (or above). This is the magic zoom level to aim for if you want to fill in/update patches on the red/green map. Current zoom is given in the top right.
- Lower zoom red/green maps are generated afterwards, but only if requested, so if you pan around at zoom level 14, you still wont see a good overview map, until you (or somebody else) view the area at zoom level 13, and then view the area at zoom level 12 etc.
- Some red patches are wrong, and when you zoom in, they turn to green. This is because recently bing have been adding lots more areas of hi res coverage. Great news, but it means this tool is extra confusing. A red patch may only be red because nobody's zoomed in to turn it green yet.
Age of tiles tool
This is a modified version of the original Bing analyzer ( https://mvexel.dev.openstreetmap.org/bing/ ) which lets you check coverage and approximate capture date for Bing aerial imagery. The dates shown in this application are taken from the tile metadata as provided by Bing. It's the best we have in the way of metadata. Zoom in and out to see even different ages of each zoom levels! See discussion for error reports.
Boundaries in the data?
Arguably you should not put boundary data into OpenStreetMap. Particularly do not group them into boundary relations. Large, detailed relations can be exceptionally slow to retrieve and cause very high server load, and will generally cause problems at the browser end when accessing via an OpenLayers slippymap client. Significant problems have already been caused by people trying to map coverage with a relation, and then posting the relation URL.
Instead you might make a simple .osm file indicating coverages, uploaded it elsewhere, and link to it.
But for getting a view of Bing coverage you can also simply link to the tool above (it has a 'permalink' feature in the top right)
