Dar es Salaam/Ramani Huria
Ramani Huria is a community-based mapping project that began in Dar es Salaam, Tanzania, training university students and local community members to create highly accurate maps of the most flood-prone areas of the city. As the maps have taken shape – their benefits have multiplied and their potential magnified, now serving as foundational tools for development within all socio-economic spheres beyond flood resilience.
Data collected as part of Ramani Huria conforms to a model. The Data Model specifies what types of attributes are collected, what answers are possible, and the style in which they are displayed on the OpenStreetMap website's rendering, Ramani Huria's own atlases (essentially QGIS styles), and the Government of Tanzania data portal. The model consists of three basic layers:
- Items that appear in the OpenStreetMap standard rendering, and therefore conform to an essentially universal schema - they should look, by and large, identical in the street map in any country. Examples include the usual classifications of roads and buildings; the usual elements of the street map.
- Items that conform to OpenStreetMap standard tagging, but don't necessarily render on the standard map style. These should nevertheless be invariant across multiple countries and contexts. Examples include drainage, which does not appear in detail as part of the usual street map style, but is nevertheless universal and should be tagged consistently regardless of the local context.
- Items that are specific to the local context, which do not (fully) appear in the OpenStreetMap standard rendering and are not particularly universal, but which are useful to support the specific goals of the local project and community. Examples include local health-care infrastructure which is organized in a context-specific fashion by the national Ministry of Health, or administrative divisions that don't easily fit into an Adm1, Adm2, Adm3 schema.
Ramani Huria Datasets
Historical Flood Extents
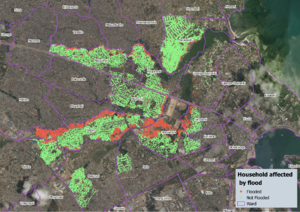
Historical flood extents conducted from August 24th, 2017 to April 12th, 2018 covered areas that are mostly affected by floods during rainy seasons in Dar es Salaam. Household surveys were conducted to capture details in subwards of the respective wards across the Msimbazi River and stream that outflow to the main river to help in the designing of the lower Msimbazi River catchment area, using the data to understand the extent to which houses are affected from Msimbazi valley.
The information captured aimed to know whether the respondent had been affected by floods in the previous years, the flood depth and flood occurrence years–historical flood events. Since the community members did not know the units of measurements in metrics, this posed a problem to the team during data collection. The team re-designed the questions to simplify the community members’ estimation of flood depths using human-scale measurements i.e. knee-deep, chest-deep, waist-deep, etc.
Spatial Extent
The historical flood extents project was conducted in 11 wards in Dar es Salaam city found along the Msimbazi River. The wards are as listed below:
| ID | Ward Name | ID | Ward Name |
|---|---|---|---|
| 1. | Buguruni | 7. | Mchikichini |
| 2. | Hananasifu | 8. | Mzimuni |
| 3. | Ilala | 9. | Ndugumbi |
| 4. | Jangwani | 10. | Tabata |
| 5. | Kigogo | 11. | Upanga Magharibi |
| 6. | Magomeni |
Methodology
Using an OpenDataKit survey form and asking questions to community members about their experience of floods in their neighborhoods. Community members of the respective wards were trained on how to collect data using ODK and were the ones to collect these information in their own neighborhood. A team of five people, with knowledge in planning and added skills of ODK, OpenMapKit and OSM was tasked to train community members on how to use ODK in filling the survey and managing the flowing data.
Statistics
Approximately 30,000 houses were surveyed during the historical flood extents
| Number of Houses | Percentage (%) |
|---|---|
| 5,960 (flooded) | 19.9 |
| 24,040 (not flooded) | 80.1 |
Visualizations
Drainage Mapping
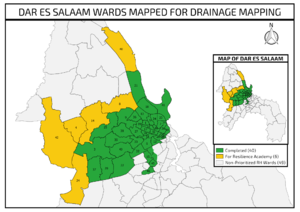
Drainage mapping was conducted on August 2017 to April 2019 in the most flood-prone areas across Dar es Salaam using cheap and practical methods. This information will be used to develop a flood model which requires accurately collected specifications of drains such as depth, width, blockage (by either vegetation or material), connectivity, and diameter (typically for culverts).
Spatial Extent
Drainage data covers 44 prioritized Ramani Huria wards most of which are along the Msimbazi and Ng’ombe rivers. 90% of the wards in the table below have been mapped; the remaining 10% will be mapped by the Resilience Academy in August - September 2019.
Methodology
Preparation of survey forms in KoBo Toolbox for the ODK application for drain segments and points. Field mappers then installed ODK on their Android phones and with the URL for the server to be used, they downloaded the survey forms, filled the required information from the field and uploaded the forms.
For data collection, measuring tapes and measuring rods━special wooden measuring sticks created by the RH team to measure the bottom width and depth of drains━were used. In some cases where trapezoidal drains are covered with water, the use of measuring rods was the best option. It enables taking measurements without the mapper having to get into the drainage channel, while for drains with narrow width the use of measuring tape was most efficient.
A 2016 COWI imagery was used for data cleaning due to its high resolution which effects fixing GPS errors. Some Android smartphones installed with ODK Collect have a GPS with an accuracy of 5 meters or which results to a +/- 5 meters error from the real position - using a high resolution imagery in data cleaning helps fixing this problem.
A small team of 12 student volunteers was trained in the specifics of drainage mapping i.e. using a measuring rods and measuring tapes to acquire dimensions of a drainage shape and size. Apart from drainage linear features━drain, culvert and ditch━the team was also taught how to map point features which support linear features, i.e. when attached to each other. For instance, drain points when explaining the uppermost part of drain and showing the blockage points. Although this team comprised of students with various backgrounds, no one had prior knowledge of drainage mapping - rather some of them had been involved in other mapping activities, such as cadastral survey.
A detailed description on how to conduct drainage mapping, tools that are used, data collection, data cleaning and running the data in the model can be found in the pocket guide to drainage mapping and the urban drainage mapping wiki.
Statistics
18350 segments of culverts, drains, ditches, and decommissioned drainage infrastructure totaling 705.739 kilometer. Whereby lined drains cover 56.69%, culverts cover 37.37% while unlined drains (ditches) cover 5.25%.
13385 drain points have been collected whereby 3.9% are blockage/damage points with either solid waste materials or sands and 4.9%are points with no_exit(drainage channel ends with no outflow)
Data Visualization
Community Assets and Threats Mapping
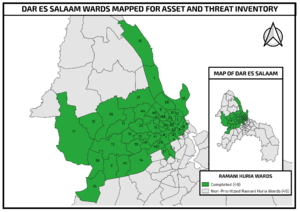
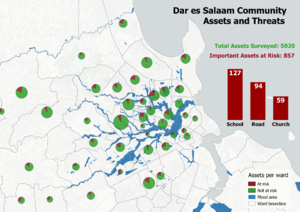
Flood risk identification of flood-prone areas of the city was conducted through a series of meetings with influential community members and leaders to identify assets, threats, and evacuation centers and issues that contribute to flooding in their subwards.
Flood risk identification of flood prone areas of the city from June 2018 to January 2019 by conducting a series of meetings with key people on specific subwards. Use of influential community members and leaders to identify assets, threats and evacuation centers and issues that contribute to flooding in their subwards.
Assets are things that are important to the community but are not at risk of flooding, threats are things that the community "thinks" may flood if the hazard continues unabated and evacuation centers are areas that the community members who have been affected by floods flee to for a safe stay. This information can only be provided by the community itself since they understand their neighborhoods better.
Spatial Extent
The inventory covered 243 subwards in 49 wards of Dar es Salaam.
| ID | Ward Name | ID | Ward Name | ID | Ward Name | ID | Ward Name |
|---|---|---|---|---|---|---|---|
| 1. | Bonyokwa | 13. | Kinyerezi | 26. | Manzese | 38. | Sandali |
| 2. | Buguruni | 14. | Kipawa | 27. | Mburahati | 39. | Saranga |
| 3. | Gongo la Mboto | 15. | Kisukuru | 28. | Mchikichini | 40. | Segerea |
| 4. | Hananasifu | 16. | Kunduchi | 29. | Mikocheni | 41. | Sinza |
| 5. | Ilala | 17. | Kwembe | 30. | Mnyamani | 42. | Tabata |
| 6. | Jangwani | 18. | Liwiti | 31. | Msasani | 43. | Tandale |
| 7. | Kariakoo | 19. | Mabibo | 32. | Msigani | 44. | Temeke |
| 8. | Kawe | 20. | Magomeni | 33. | Mwananyamala | 45. | Ubungo |
| 9. | Kigogo | 21. | Makongo | 34. | Mzimuni | 46. | Ukonga |
| 10. | Kijitonyama | 22. | Makuburi | 35. | Ndugumbi | 47. | Upanga Magharibi |
| 11. | Kimanga | 23. | Makumbusho | 36. | Pugu | 48. | Upanga Mashariki |
| 12. | Kinondoni | 24. | Makurumla | 37. | Pugu Station | 49. | Vingunguti |
Methodology
Meetings were set with community leaders and influential people i.e. religious leaders in the specific wards. We first introduced how the data can help in reducing flooding, then asked them to identify and trace their boundaries on a map printed on A1 and point out assets and disaster threats in their neighbourhoods. We also printed satellite image maps of the respective subward to simplify identification of areas in their subwards.
Each meeting had 10 to 12 participants—2 religious leaders, 1 leader of community based organisation (CBO) and NGO available at the subward, 3 representatives from Subward’s Health, and Environment committees, 1 prominent elderly person with good knowledge of the neighbourhood, 1 prominent young person with good knowledge about the neighbourhood and 1-6 shina leaders. These participants were chosen following gender balance, religion, social relations and their local knowledge of the neighborhood—and 6 student mappers to facilitate the process. Student mappers split community members into three groups, each group guided by two students.
The discussion was based on three major key points:
- Assets (Important things in the subward)
- Assets under threats (in case the subward floods)
- Main causes of flood in the subward
To develop a complete detailed map the following process was followed:
- Mapping all important features in the subward in collaboration with community members using free Android Applications such as OpenDataKit and OpenMapKit—This component was true to the wards that were not previously mapped by Ramani Huria.
- Data Entry, Cleaning and Map Making using QGIS to prepare first draft maps to be used in community meetings.
- Conducting community meeting using the first draft maps as guide basemaps in risk identification.
- Collecting missing data that community members mentioned and were not found on the map using ODK and OMK.
- Lastly, cleaning the collected data, writing reports of the meetings and producing maps that correspond with the reports.
Over 300 university students with guidance from 12 supervisors during the 2018 Industrial Training, after receiving two weeks’ worth of training in community engagement, data collection tools, and map making. More detailed descriptions to the methodology and human resources that were used in the Assets and Threats project can be found in the Community Asset and Threat Handbook.
Statistics
A total of 5020 asset points, road and road names and 1538 landmarks were collected during the project. These include:
| Points of Interest | Total number of points collected |
|---|---|
| Assets at risk but not important | 28 |
| Evacuation centers | 42 |
| Important assets and at risk | 857 |
| Important assets but not at risk | 4,093 |
| Roads and road names (ways) | 65,868 |
| Landmarks | 1,538 |
Points that were used as evacuation centers were mostly government facilities such as schools, subward and ward offices, open areas and also religious institutions. For areas with no evacuation centers, residents would evacuate to their neighbors and relatives.
Data Visualization
Data for Waste Management
To support waste management in the city, Ramani Huria conducted a number of activities and provided data that supported cleanup during the World Clean-up Day in 2018. The team also went further into working with trash collection companies and providing support for tracking their clients and creating effective systems of waste collection on three pilot wards. The pilot was done in both formal and informal settlement.
Trash Points Mapping in Dar es Salaam
On 2018-07-30 to 2018-08-03 Ramani Huria collaborated with Nipe Fagio (“give me the broom” in Swahili), a civil society organisation founded in 2013, to map trash sites in Dar es Salaam. The trash mapping initiative was part and parcel of the large Let’s-Do-It-World campaign, a civic-led mass movement to clean up countries.
The mapped data helped to identify the locations of the areas with poorly managed waste materials, type and size of waste and clean up methods. This process helped ease cleaning the city on September 15th, 2018, a celebration of World Clean Up Day.
Spatial Extent
| ID | Ward Name | ID | Ward Name | ID | Ward Name | ID | Ward Name | ID | Ward Name |
|---|---|---|---|---|---|---|---|---|---|
| 1 | Buguruni | 11 | Kigogo | 21 | Magomeni | 31 | Mikocheni | 41 | Sinza |
| 2 | Buza | 12 | Kijitonyama | 22 | Makongo | 32 | Msasani | 42 | Tabata |
| 3 | Charambe | 13 | Kimanga | 23 | Makuburi | 33 | Msigani | 43 | Tandale |
| 4 | Gongo la Mboto | 14 | Kimara | 24 | Makumbusho | 34 | Mwananyamala | 44 | Tandika |
| 5 | Hananasif | 15 | Kinondoni | 25 | Makurumla | 35 | Mzimuni | 45 | Temeke |
| 6 | Ilala | 16 | Kinyerezi | 26 | Manzese | 36 | Ndugumbi | 46 | Ubungo |
| 7 | Jangwani | 17 | Kipawa | 27 | Mbezi | 37 | Pugu | 47 | Ukonga |
| 8 | kariakoo | 18 | Kunduchi | 28 | Mburahati | 38 | Sandali | 48 | Upanga Mashariki |
| 9 | Kawe | 19 | Kwembe | 29 | Mchikichini | 39 | Saranga | 49 | Upanga Magharibi |
| 10 | Kigamboni | 20 | Mabibo | 30 | Mianzini | 40 | Segerea | 50 | Vingunguti |
Methodology
Using OpenDataKit to collect trash points in the city and filling out the survey on the type of waste (debris, glass, metal), and the size of trash (hand full, bag full, truckload, cart etc) to ease cleaning process. Before field work, introduction letters were sent to ward officers so they can be in- formed and for mappers’ security in case there is any assistance needed from the ward office.
Statistics
A total of 20,392 points were collected and reduced to 9,452 after cleaning.
Data Visualization
Trash Mapping in Formal Settlement
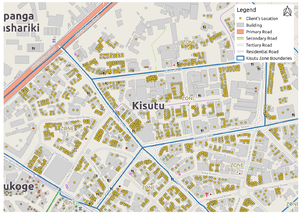
Ramani Huria and Green Waste Pro Ltd. (GWPL) partnered in August to November 2018 to provide datasets for waste management. Green Waste Pro is a private company specialized in waste management with the aim to offer eco-friendly solutions in cleaning and waste management. They mostly operate in formal settlements. The company needed digital methodology to obtain clients’ information including locations, clients contacts etc, so they can track clients and provide services accordingly.
Spatial Extent
| ID | Ward Name |
|---|---|
| 1 | Gongo la Mboto |
| 2 | Kisutu |
| 3 | Kivukoni |
| 4 | Mchafukoge |
Methodology
Collection of building data for each structure and resident/client data for each unit (residence or business) within the buildings in Kisutu and Mchafukoge wards in Dar es Salaam. Robust barcode stickers were placed at the entry of each unit, and a survey was completed for each unit where possible. The building data was uploaded to OSM, along with some amenity information gleaned from the unit surveys, and the remainder of the per-unit data was provided to GWPL.
Statistics
A total of 4706 clients mapped. Around 4500 client data points are used by the company to collect trash.
Data Visualization
.
Trash Mapping in Informal Settlement
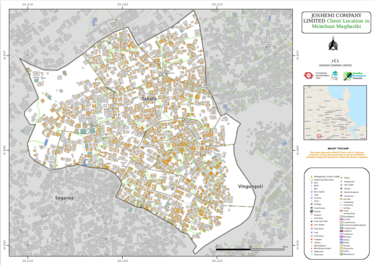
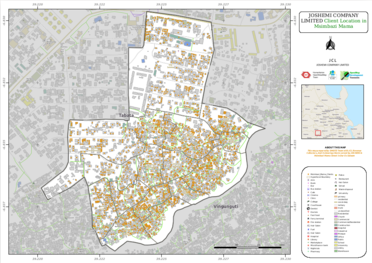
Ramani Huria partnered with Joshemi Company Limited (JCL), a company dealing with trash collection in Tabata ward with eight subwards therein. JCL needed to know the number of clients as it was very difficult to track them all revenue flow and an effective feedback system on services provided by the company. The aim was shifting JCL’s analogue system of trash collection to a digital system by providing them with their own maps of clients’ locations and a system of tracking them. This way, JCL would improve their services to clients, increase their revenues and create an effective waste collection mechanism.
Spatial Extent
2 pilot subwards (Msimbazi Magharibi and Msimbazi Mama) out of eight subwards in Tabata ward.
Methodology
OpenDataKit (ODK) Collect and OpenMapKit (OMK) an extension of ODK which is a free and open android application for data collection were used. The team worked with revenue collectors to map the clients as they have a better understanding of the area to simplify the process of data collection.
Ramani Huria team switched to working with local community leaders (wajumbe) who better understand their area of administration which normally ranges from 30 to 200 households. Among other things, wajumbe are responsible for allocating resident leases and titles, therefore were able to provide clients’ details even when the clients were absent. Tabata ward is 50% informally developed hence most houses do not have house numbers. In order to connect the buildings’ geo locations with client information we developed unofficial numbers as a baseline for the use of collected data.
A system to track the monthly income revenue of the clients was created as a final output of the data. This was created in a Google spreadsheet containing client details and wajumbe names. The Ramani Huria team trained JCL revenue collectors how to update the monthly income generation column in the spreadsheet. The sheet was also integrated to OMK to ensure every customer is reached by the revenue collectors.
A team of 4 student volunteers working with revenue collectors from JCL to collect clients’ information in the 2 subwards—Msimbazi Magharibi and Msimbazi Mama—in Tabata ward. A detailed description on how the project was conducted, achievements, challenges and next plans for the trash mapping in informal settlements can be found in the Tabata Trash Mapping Report.
Statistics
20163 client points collected in 2 subwards of Tabata ward.
Data Visualization
.
Building Footprint Digitization
Re-digitization of the city was conducted to update and improve the quality of already digitized layers using imagery with 10cm resolution provided by the Ministry of Lands, Housing and Human Settlements, which was done bythe consulting firm COWI. Previously the city was digitized using either Bing, Mapbox or Maxar (formerly Digital Globe) imagery, all of which have lower resolutions compared to the COWI imagery.
Aligning buildings with a higher resolution image of 10cm provided by COWI company using Mbtiles created in GDAL (gdaladdo)—a utility used to build or rebuild overview images. Using the 2016 COWI imagery in combination with the HOT Tasking Manager, buildings were re-digitized in JOSM and validation of the re-digitization was done by the validation team.
Spatial Extent
28 out of 44 Ramani Huria prioritized wards in Dar es Salaam have been re-digitized.
| ID | Ward Name | ID | Ward Name | ID | Ward Name | ID | Ward Name |
|---|---|---|---|---|---|---|---|
| 1. | Upanga Mashariki | 13. | Upanga Magharibi | 25. | Kimanga | 37. | Segerea |
| 2. | Makurumla | 14. | Kinondoni | 26. | Tandale | 38. | Kurasini |
| 3. | Mburahati | 15. | Pugu | 27. | Kijitonyama | 39. | Msasani |
| 4. | Sandali | 16. | Buguruni | 28. | Tabata | 40. | Temeke |
| 5. | Vingunguti | 17. | Makumbusho | 29. | Saranga | 41. | Kwembe |
| 6. | Mzimuni | 18. | Makuburi | 30. | Mwananyamala | 42. | Makongo |
| 7. | Magomeni | 19. | Msigani | 31. | Mchafukoge | 43. | Kipawa |
| 8. | Mchikichini | 20. | Kinyerezi | 32. | Ilala | 44. | Kunduchi |
| 9. | Jangwani | 21. | Hananasifu | 33. | Mikocheni | 45. | Kawe |
| 10. | Mabibo | 22. | Gongo la Mboto | 34. | Kariakoo | 46. | Manzese |
| 11. | Gerezani | 23. | Keko | 35. | Ndugumbi | 47. | Kigogo |
| 12. | Kimara | 24. | Sinza | 36. | Ubungo | 48. | Ukonga |
Methodology
Aligning buildings with higher resolution image of 10cm provided by COWI company using Mbtiles created in GDAL (gdaladdo)—a utility used to build or rebuild overview images. Supervisors of the team created mapping projects on HOT Tasking Manager which were then assigned to the digitization team. Using the 2016 COWI imagery, buildings were re-digitized in JOSM and validation of the re-digitization was done by the validation team.
25 digitizers who participated in this activity were just part of 100 that were trained to digitize buildings on the mini-grids project in early 2018. They were trained for 3 weeks in order to achieve good quality data. Based on the skills that they obtained, they have been participating in mapping buildings and roads as well.
Statistics
Before redigitization, buildings were fewer in number compared to after redigitization using the 2016 high resolution COWI imagery, this was due to different facts including:
- The imagery that were used before were not very clear, hence when digitizing the buildings, some would blur or would be mistaken for other features such as cars.
- The imagery used were outdated compared to the 2016 COWI imagery. In this case, the number of buildings had increased over the years.
| Buildings | Roads | ||
| Year | Number of Buildings | Year | Kilometers of Roads |
| 2014 | 3,386 | 2014 | 2,501 |
| 2015 | 3,491 | 2015 | 3,079 |
| 2016 | 302,810 | 2016 | 4,754 |
| 2017 | 460,169 | 2017 | 5,949 |
| 2018 | 946,936 | 2018 | 17,895 |
| Present | 1,004,267 | Present | 18,069 |
Data Visualizations
.
Hyperlocal Administrative Boundary Mapping
Shinas, are divisions within subwards regarded as political boundaries administered by local leaders (wajumbe). Previously referred to as Ten Cell divisions as they were originally comprised of ten households, these divisions now comprise of 30 to 200 households due to the increase in population. Wajumbe are increasingly functioning as non-partisan public servants, often the first point of interaction between the government and citizens.
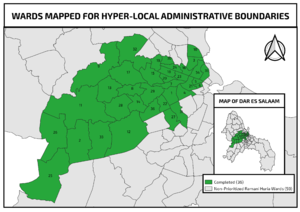
Given the rate of urbanization in Dar es Salaam, it is very difficult to locate people and their respective addresses due to the unplanned and informal settlements nature of these communities. Using more granular boundaries, however, makes it easier to locate people and provide services more precisely. The Ramani Huria team mapped hyperlocal boundaries in Dar es Salaam from September to December, 2018
Spatial Extent
36 out of 44 prioritized Ramani Huria wards in Dar es Salaam.
| ID | Ward Name | ID | Ward Name | ID | Ward Name | ID | Ward Name |
|---|---|---|---|---|---|---|---|
| 1. | Tandale | 10. | Makurumla | 19. | Mchikichini | 28. | Mnyamani |
| 2. | Hananasifu | 11. | Upanga Mashariki | 20. | Jangwani | 29. | Buguruni |
| 3. | Kinyerezi | 12. | Kigogo | 21. | Magomeni | 30. | Kimanga |
| 4. | Temeke | 13. | Ukonga | 22. | Mzimuni | 31. | Pugu |
| 5. | Ubungo | 14. | Kipawa | 23. | Tabata | 32. | Liwiti |
| 6. | Ndugumbi | 15. | Kinondoni | 24. | Gongo la Mboto | 33. | Segerea |
| 7. | Ilala | 16. | Kimara | 25. | Makuburi | 34. | Kisukuru |
| 8. | Sandali | 17. | Upanga Magharibi | 26. | Manzese | 35. | Vingunguti |
| 9. | Mburahati | 18. | Mabibo | 27. | Kariakoo | 36. | Pugu Station |
Methodology
- Introduction of the project from subward offices followed bytraining of selected community mappers on how to use ODK.
- Trained mappers worked with wajumbe to trace their administrative boundaries. The boundaries were traced using ODK trace and then added to QGIS for further processing. With assistance from supervisors, the collected data is checked and uploaded to the server.
- Data cleaning was done using excel and map creation using QGIS.
Mapping of the hyperlocal administrative boundaries was done by 15 student volunteers with guidance from community members, mainly wajumbe and subward officers.
Statistics
The Humanitarian OpenStreetMap Team under the Ramani Huria project was able to map more than 3000 hyperlocal boundaries in Dar es Salaam with the sole focus of incorporating a layer of health access information and issues to flood plans. This will better inform emergency responders and flood response plans.
Data Visualization
Soil Sediment Sampling
Ramani Huria and JBA Consulting partnered in October 2018 to develop a surface soil sediment dataset for the greater Dar es Salaam region of Tanzania. This was intended to support a geomorphological assessment taking into account soil sediment characteristics for erosion and flood risk studies. A national-level soil profile had existed for Tanzania prior to this effort but contained only a single sample from Dar es Salaam. This was not sufficient to analyze erosion potential across the city.
Spatial Extent
Dar es Salaam and neighboring districts of Pwani region i.e. Bagamoyo, Kibaha and Kisarawe.
Methodology
A 2km by 2km grid for site selection was created. A set of data was recorded at each site using OpenDataKit’s Android application ODK Collect. Each field sampling team of two people carried the following equipment: trowel or small shovel, plastic “ziploc” bags with 1 kg capacity, Android phone pre-loaded with ODK Collect, a separate maps and navigation application, Maps.me—pre-loaded with the locations to be visited, first aid kit, marker pens, permission letter for the sampling activity from the municipal authorities and a tape measure.
A geomorphologist provided training to the team and set up our own citizen-style (local) lab to analyze the soil samples. The pair of samples—top and bottom—from each site was passed through a set of progressively finer-mesh sieves, resulting in nine separate fractions. Each fraction was weighed. The resulting measurements, which represent the proportion of each sediment particle size at each site, were recorded.
In the office, materials were used for analysis: a set of metal sieves, scales, hand wash station and gloves, brush, cloth and towel for cleaning sieves, an Android phone with ODK Collect and sieving survey.
A team of 14 recent university graduates; 10 were field mappers to collect soil data and 4 office technicians to do analysis (sieving and measurements) were trained in two days by JBA Consulting. A detailed Soil Sediment Sampling Wiki was prepared by the HOT team explaining all the procedures that were conducted by the team to obtain sediment material from all over the city and some parts of Pwani region.
Statistics
731 soil sample points created using a 2 km grid. 643 points sampled and sieved; 88 sample points were either inaccessible or hard to collect sample e.g. paved areas, military base.
Data Visualization
Community Flood Response
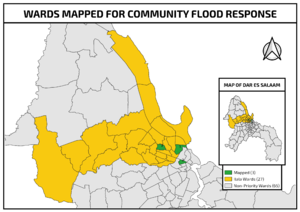
As a response to heavy rainfall in March and May 2019 which resulted to heavy flooding in some wards of Dar es Salaam, the Ramani Huria team conducted field mapping to engage affected communities with the aim of conducting a rapid assessment and producing impact maps. With reference to the past flood responses done in the city, the Ramani Huria team led the way to identify effects in the communities and create maps to help responders on the ground. The team responded by visiting flooded areas to assess the impact.
Through using a local leaders’ contact database that contains more than 3000 phone numbers, the team was able to contact these local leaders to remotely identify the subwards affected and the effects. This information will be used to conduct a damage assessment of the affected areas. The data has been shared with the Red Cross in Tanzania, which will help them to prepare for the next rainy season and for risk prevention analysis.
Spatial Extent
| ID | Ward Name |
|---|---|
| 1. | Hananasifu |
| 2. | Jangwani |
| 3. | Tandale |
| 1 | Mwananyamala | 8 | Tabata |
| 2 | Kigogo | 9. | Mzimuni |
| 3 | Kunduchi | 10. | Saranga |
| 4 | Vingunguti | 11. | Liwiti |
| 5 | Mnyamani | 12. | Manzese |
| 6 | Mabibo | 13. | Kimara |
| 7 | Tandale | 14. | Makumbusho |
Methodology
Meetings with ward leaders in the three most affected subwards and zone the affected areas on a printed map with tracing paper and calculate the number of affected houses. Field visit to survey the affected area and take points to verify what community leaders zoned on the map.
A team of volunteers reached several wards in Dar es Salaam to collect data on affected buildings in the rains that hit the city on March and May, 2019. The team used printed maps to work with the community members to determine the affected areas. The team prepared a detailed Community Flood Response report that explains all the activities conducted during both flood responses in Dar es Salaam city.
Statistics
The survey conducted in 3 wards in Dar es Salaam by the Ramani Huria team showed that a total of 1907 houses were flooded during the heavy rains in March.
| Ward | Subward | Total number of houses flooded |
|---|---|---|
| Hannanasifu | Mkunguni B | 150 houses |
| Tandale | Mkunduge | 1100 houses |
| Tandale | Sokoni | 230 houses |
| Jangwani | Mtambani | 427 houses |
| Total | 1907 houses | |
After the rains that hit Dar es Salaam city in May, 2019, the Ramani Huria team conducted a community flood response in 14 wards which showed that a total of 7263 buildings were flooded with 80 buildings completely destroyed and infrastructure (roads, storm water drains) left destroyed.
| S/N | Ward | Subward | # of buildings flooded | S/N | Ward | Subward | # of buildings flooded |
| 1 | Mwananyamala | Bwawani | 1130 buildings | 14 | Tabata | Msimbazi | 161 buildings |
| 2 | Kigogo | Mbuyuni | 1151 buildings | 15 | Vingunguti | Majengo | 150 buildings |
| 3 | Kunduchi | Kilongawima | 615 buildings | 16 | Mwananyamala | Kwa kopa | 138 buildings |
| 4 | Vingunguti | Mtambani | 520 buildings | 17 | Manzese | Uzuri | 112 buildings |
| 5 | Mnyamani | Faru | 469 buildings | 18 | Tabata | Mandela | 111 buildings |
| 6 | Mabibo | Mabibo Farasi | 419 buildings | 19 | Mwananyamala | Msisiri A | 100 buildings |
| 7 | Tandale | Muhalitani | 371 buildings | 20 | Kunduchi | Pwani | 70 buildings |
| 8 | Tabata | Tenge | 360 buildings | 21 | Kimara | Mavurunza | 64 buildings |
| 9 | Mwananyamala | Msisiri B | 274 buildings | 22 | Kigogo | Kigogo kati | 62 buildings |
| 10 | Mzimuni | Mwinyimkuu | 233 buildings | 23 | Manzese | Mvuleni | 55 buildings |
| 11 | Saranga | Stop over | 211 buildings | 24 | Makumbusho | Mbuyuni | 50 buildings |
| 12 | Vingunguti | Miembeni | 209 buildings | 25 | Kimanga | Tembomgwaza | 38 buildings |
| 13 | Liwiti | Amani | 190 buildings | 26 | Kijitonyama | Mpakani B | 0 buildings |
| Total | 7263 buildings | ||||||
Data Visualization
Ramani Huria Base Data
Ramani Huria teams collect and create a wide range of base-map data, which primarily go to the OpenStreetMap platform. This is the underlying map layer upon which specific datasets important to resilience are overlaid—the equivalent of common web based maps such as Google Maps, but freely available open data backed by a global community and extensive quality assurance.
This includes roads, buildings, health care facilities, schools and universities, transportation infrastructure such as bus stops and Rapid Transit lines, businesses such as restaurants, shops, salons and hotels, public offices, recreation facilities, natural features such as rivers and wetlands, parks, etc. This data is being constantly updated as the physical features of the city change and evolve, as well as when users or the community choose to focus on a particular feature type (for example, if a local agency wishes to visualize where people get drinking water, volunteers—including Ramani Huria students—may specifically focus on features relevant to that need for a time.
Most Ramani Huria data is available on OpenStreetMap, but specific resilience related datasets (including most of those described in the preceding sections) are collated in static for to platforms such as the Resilience Academy GeoNode. The base data described here is not generally kept in a static form, but is viewed on the OpenStreetMap website or accessed via tools such as the HOT Export tool or Overpass API. These tools provide an up-to-the minute snapshot of the latest data at any time, and are therefore preferable to static repositories.
Spatial Extent
OpenStreetMap is a global map! There is no particular boundary or extent to this data. However, the Ramani Huria team's efforts are focused on greater Dar es Salaam, with a particular focus on the 49 Ramani Huria 2.0 wards (just about 50\% of the wards in the city):
| ID | Ward Name | ID | Ward Name | ID | Ward Name | ID | Ward Name | ID | Ward Name |
|---|---|---|---|---|---|---|---|---|---|
| 1. | Bonyokwa | 11. | Kimanga | 21. | Magomeni | 31. | Msasani | 41. | Sinza |
| 2. | Buguruni | 12. | Kimara | 22. | Makongo | 32. | Msigani | 42. | Tabata |
| 3. | Gongo la Mboto | 13. | Kinondoni | 23. | Makuburi | 33. | Mwananyamala | 43. | Tandale |
| 4. | Hananasifu | 14. | Kinyerezi | 24. | Makumbusho | 34. | Mzimuni | 44. | Temeke |
| 5. | Ilala | 15. | Kipawa | 25. | Makurumla | 35. | Ndugumbi | 45. | Ubungo |
| 6. | Jangwani | 16. | Kisukuru | 26. | Manzese | 36. | Pugu | 46. | Ukonga |
| 7. | Kariakoo | 17. | Kunduchi | 27. | Mburahati | 37. | Pugu Station | 47. | Upanga Magharibi |
| 8. | Kawe | 18. | Kwembe | 28. | Mchikichini | 38. | Sandali | 48. | Upanga Mashariki |
| 9. | Kigogo | 19. | Liwiti | 29. | Mikocheni | 39. | Saranga | 49. | Vingunguti |
| 10. | Kijitonyama | 20. | Mabibo | 30. | Mnyamani | 40. | Segerea |
Methodology
Ramani Huria base data is collected and created using a range of tools in the OpenStreetMap and Humanitarian OpenStreetMap Team ecosystem, including but not limited to:
- The Java OpenStreetMap Editor (JOSM)
- OpenDataKit (ODK) Collect
- OpenMapKit (OMK)
- ID Editor
- HOT Tasking Manager
- QGIS
The two main categories of data creation are remote mapping and field mapping. Remote mapping is done using aerial or satellite imagery, usually with the JOSM tool, a desktop editing software that provides a comprehensive suite of tools for viewing imagery and creating vector features upon the raster background.
Ramani Huria teams alongside global OpenStreetMap volunteers have digitized essentially every visible feature in the aerial imagery of the greater Dar es Salaam city, including over one million individual buildings and virtually all roads.
Field mapping, usually using OpenDataKit or its derivative OpenMapKit, involves physically visiting features to add local information such as road names, building type, amenities, etc.
Ramani Huria teams sometimes directly digitize base data from aerial or satellite imagery, particularly when there is a specific need. However, more often the Ramani Huria supervisors teach and mentor volunteers to digitize, either during the Industrial Training programs or during mapathon events.
The Ramani Huria motto has been "Local People, Local Devices, Open Knowledge." The key to the success of the project has been empowering citizens of Tanzania to map their own environment. While some field mapping━such as the technically demanding drainage mapping━is carried out directly by Ramani Huria teams, much of the work is done by students during the Industrial Training programs, or even by community members themselves, who are trained to use OpenDataKit and encouraged (often with a small stipend or donation of mobile credit) to survey their own neighborhoods.
