Antarctica/Creating a map
Due to its position around the South Pole the usual map projections show Antarctica rather distorted. This page gives you some tips how to create specialised Antarctica maps.
Projection
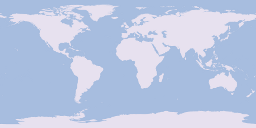
On the popular Mercator projection (EPSG:3857) used in the usual tiled web maps the area below about 85° South (and above 85° North) is not shown at all. You can use the EPSG:4326 longitude and latitude directly (plate carrée projection) which has huge distortions around the poles, but at least it can show all locations.
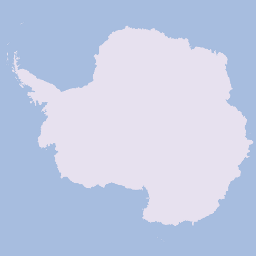
A better projection is the polar stereographic projection (EPSG:3031 for the South Pole) which shows the pole in the middle. Distortions get larger the farther you get away from the pole, but below 60° they are not that bad. (Any w:azimuthal projection will produce the desired circle-look, but only stereographic is conformal like the Mercator. Also like the Mercator, it distorts area as the distance from the center increases.)
With Quantum GIS
You'll probably have to switch on "Enable 'on the fly' CRS transformation" in the "Coordinate Reference System (CRS)" tab in the "Project Properties" dialog. Then choose "WGS84 / Antarctic Polar Stereographic EPSG:3031" as your coordinate reference system.
Web Map with Mapnik
See https://github.com/MaZderMind/mapnik-stylesheets-polar for instructions on how to create something like http://polar.openstreetmap.de/. (The osm.de site is currently offline. For an example involving the arctic [and not using the stereographic projection!], see http://webmap.arcticconnect.ca/.)
Size of the map
Unlike with web mercator projection where you have fixed bounds for the map (at +/-180° to the west and east, at approximately 85° to the north and south) you have to choose a map size and rotation angle in case of polar stereographic projection. The coordinates are specified in meters with the origin at the south pole (and in degrees an angle of longitude for one axis, usually for the chosen central meridian that will be oriented upward in the vertical direction from the pole located in the center of the rendered map).
A 6000km area (-3000000/-3000000 to 3000000/3000000) covers all of Antarctica including all islands south of -60° and does not include any land north of this limit.
Resolution and zoom levels
Since a map with such bounds covers a much smaller area than a normal web map (which covers nearly the whole earth) the scale of the map at a certain zoom level is different from a normal web map. Since the scale of web mercator strongly varies depending on the latitude no fixed relation can be given but it will usually be best to use render settings with 2 or 3 zoom levels offset to start with (so rendering tiles for zoom=4 with settings normally used for zoom=6 or zoom=7). In addition to that the low density of many features in Antarctica allows displaying things (like research stations and other man made structures) at a lower zoom level than usually done in a normal map rendering.


