Frederick County, Virginia, Building Import
Import building footprints for Virgina (USA) from the VGIN. The import is currently IN REVIEW until Nov 1 2024
Import Proposal Available Here (Shapefile, 8MB)
Goals
Add missing FredCo buildings to OSM to massively help local mappers by adding 59k missing buildings to this county. Buildings that already exist in OSM for Frederick County (5.7k) will NOT be modified.
This import will not conflate with the Virginia Address Points dataset as this introduces potential for errors, would not affect the 5.7k existing buildings, and can be done later in a distinct import.
This import will not include the independent cities nearby, notable Winchester VA, as it's my first import and a rural region seems simpler as a learning exercise
Schedule
- 13 Oct - Download dataset
- 18 Oct - Finish data prep and share with community for review
- Upload schedule TBD
Import Data
Data source: Virginia Geographic Information Network (see Virginia/VBMP)
ODbL Compliance verified: Yes. VGIN public domain data has been used in multiple prior works. Currently per the VGIN website, "The reference layers are defined as non-secure, public domain datasets that are authored and created by governmental and other entities."
Data Files
Background
VGIN is directed by Code of Virginia to maintain statewide orthoimagery refreshed on a four year cycle. From 2002 to 2024 imagery was updated on a ~3year cycle with 1/3 of the state updated each year.
The Building Footprint layer is part of the Virginia Base Mapping (VBMP) layers and is published quarterly. It contains outlines of structures remotely rendered through digitizing of VBMP digital imagery, local government subdivision plats, and other sources. Building footprints carry no addressing, ownership, resident information, or construction specifications.
Known Dataset Traits & Issues
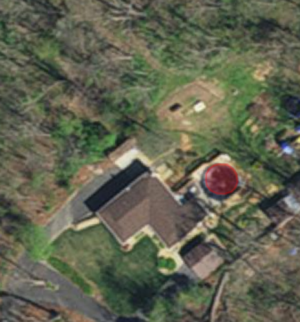
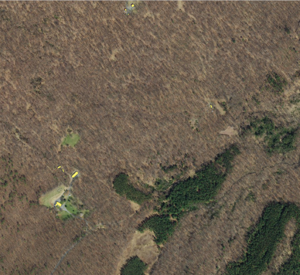
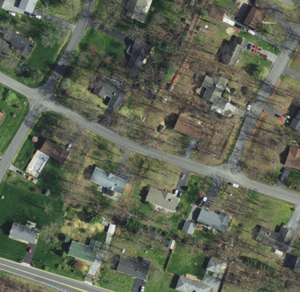
Major Positive: VGIN imagery for Frederick County was collected in winter after the leaves have fallen but before snow. This makes it excellent for aerial tracing as structures are readily visible. See Example 6 below
Moderate: Shed retailers (sellers of garden sheds, storage sheds, etc) often leave their structures in a lot. VBMP counts these as buildings, which is correct technically, but as they are moved frequently a human would not map them until they are "semi-permanent" e.g. installed on someone's property. See example for
Valley Structuresbelow. I have manually removed all instances I found (there are about 10 shed retailers in the Fred. Co region which all shared the same issue). Similar issue fixed for some tractor trailer parking lotsMajor: VBMP is known to be of highly varying quality region-by-region. To address this, I am focusing on one county which (so far) appears high-quality
- Moderate: VBMP typically includes decks and patios in building footprints leading to excess vertex counts and odd building outlines
- Moderate: VBMP counts most covered structures as buildings e.g. covered walkways, lean shelters which results in larger-than-normal buildings when you are dealing with a 'campus' as the individual building polys are often "joined" by covered walkways
- Minor: VBMP is missing some buildings, especially industrial buildings with white roofs. Not of higher concern as these are few in number and often already present on OSM due to being readily visible in most imagery
- Minor: VBMP does not always break row homes into one 'building' polygon per residence, sometimes there is a single polygon for all homes in the same physical building. Same as a human mapper would do
- Minor: VBMP data is from ~2022 and some structures may have been (re)moved. In manual QA I've seen a few temporary sheds. Future work could consider building removal, but IMO that's better left for human verifiers not automated imports given the low instance count
- Minor: The building footprints dataset and the VBMP most recent imagery dataset are not always from the same time window, leading to inaccuracies when the buildings change location. This is mainly an issue for sheds, construction trailers, trailer homes, etc. There are occasional not-actually-present buildings due to these errors. IMO most issues have been found & remediated during the data preparation phase.
Import Size
There are 5,739 buildings in OSM for Frederick County as of 13 Oct. Added the cleaned VBMP dataset would result in 64,808, an 11x increase.
| Preparation Stage | Building Counts |
|---|---|
| 01 - VBMP All | 4,395,463 |
| 02 - VBMP Fred Co only | 64,759 |
| 03 - VBMP Buildings NOT in OSM | 59,291 |
| 04 - VBMP Post Preparation
(ready for import) |
59,069 |
Import Type
One Time Import
New data is released quarterly, so future contributors may choose to repeat this process
Data Preparation
Explaining how the initial data was loaded, processes, and prepared for import
- Loaded VirginiaBuildingFootprint -- 2024 Q3 (entire dataset) into QGIS
- Filtered to
LOCALITY = 'Frederick County' Used QuickOSM plugin to download OSM buildings in Frederick County, Virginia
[out:xml] [timeout:25]; {{geocodeArea:Frederick County, Virginia}} -> .area_0; ( node["building"](area.area_0); way["building"](area.area_0); relation["building"](area.area_0); ); (._;>;); out body;Note: QuickOSM generates 3 layers - ways, nodes (typically entrances/exits referenced by the building way) and lines (relations referenced by building ways). We will focus on the ways as those are the footprints of interest. There is only one relation
Note: VGIN uses
EPSG:3968 - NAD83 / Virginia Lambertwhile OSM usesEPSG:4326 - WGS 84. QGIS recommended (and I accepted) the Inverse of NAD83 to WGS 84 (40) + Virginia Lambert Conic Conformal transform identified byIdentifiers: INVERSE(DERIVED_FROM(EPSG)):1736, EPSG:3967Join OSM and VGIN data
Using VGIN as the target layer, add attributes from all spatially joined OSM buildings
Filter items already present in OSM
Filter to features where
"osm_id" is NULLto remove all OSM buildingsUpdate labels
Remove all labels, add
building=yesManually fix of tiny polygons
Searched for buildings smaller than 20m2 and manually removed inaccurate entries such as for-sale movable sheds sitting in sale lots. Manually merged inaccurate entries such as single-family homes incorrectly split into two polygons. Most issues were in structures under 13m2
Run QGIS Topology Checker & manually fix issues
Check for invalid geoms OR duplicates OR multi-parts. No issues detected
Check for gaps. 149 issues found, fixed by manually editing features. Most issues were pools (see below). VGIN often incorrectly perceives a pool/deck/exterior stairs and any surrounding walkway as being part of the building yet (correctly) understands the pool is not a building thus leaves a gap in the footprint polygon. Note that not all 'gaps' are immediately incorrect. The San Damiano Monastery in OSM one such example - there are about 15 cases of 'correct' gaps in the final dataset. small number of gaps were due to digitization errors, seemingly often caused by incorrect building detection such as a car parked close to a small house or potentially attempting to overlay "old" building footprints with "newer" footprints when aerial imagery was re-digitized. The fix is remove the offending poly and repair the correct one such that it follows the correct outline from the latest imagery
- Check for overlaps: There were ~5. My QGIS skills are limited and the issues were all townhomes, so I just merged the individual units into a unified poly where needed
Simplify Geometry
Union nearby nodes using a tolerance of 1-ft. Reduced nodes from 582,599 to 549,797, or 5.6%. Re-run topology checks to ensure no issues
Check for excessive points
Added field for
num_points($geometry)and manually reviewed highest point-count polygons. No issues foundManual QA
Tagging Plans
Only building=yes as no other useful fields are present
Workflow
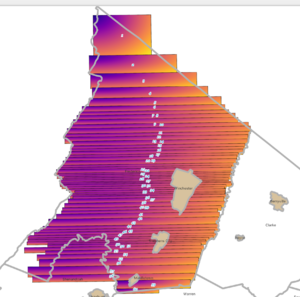
- Used QGIS to split import layer into 60 sub-layers with 1k entries each. Sub-layers started with NW features then proceeded towards SE, see graphic for visualizing of resulting chunk extents. 1k chunk size ensures we don't overload OSM servers. See collapsed section below for code
- Load each chunk into JOSM
- Download existing OSM data for the chunk extent Note: Be sure to download OSM data into the same layer as the chunk data so they are combined into one dataset. You will need to also uncheck 'Discourage Upload'
- Run validity checker and resolve issues. Typically these are when non-building data intersects the newly-added building data, such as existing OSM roads
- Upload with advanced settings to ensure we get one changeset per chunk with about 500 objects per request (typically, 5 to 10 requests per changeset)
- Update the 'Import Status Per Upload Chunk' table below
Note: Initially ran into the rate limit for my import user - waiting for ~50 minutes then re-uploading allowed me to complete the first changeset without need a revert, and I have since emailed the DWG asking for the `importer` role to be added to my import account.
import os
from qgis.core import QgsVectorFileWriter, QgsCoordinateReferenceSystem, QgsProcessingException

from qgis.core import QgsWkbTypes


# Set target CRS to EPSG:4326 (WGS 84)
target_crs = QgsCoordinateReferenceSystem("EPSG:4326")

# Define the input layer and output directory
# Use the currently selected layer in QGIS
layer = iface.activeLayer()
output_dir = "/Users/hamiltont/Downloads/export_test"

# Number of features per chunk
chunk_size = 1000

# List to store chunk extents for eventual output
chunk_extents = []

if not layer.isValid():
    print("Error: Original layer is invalid.")
else:
    print("Original layer is valid.")
geom_type = layer.geometryType()
print(f"Original layer geometry type: {geom_type}")
print(f"Original layer geometry WKB type: {layer.wkbType()}")
print(f"Original layer geometry: {QgsWkbTypes.displayString(layer.wkbType())}")
print(f"Original layer CRS: {layer.crs().authid()}")


# Function to get the centroid coordinates of a feature
def get_centroid_coords(feature):
    geom = feature.geometry().centroid()
    return (geom.asPoint().y(), geom.asPoint().x())  # (Y, X) coordinates

# Sort all features by Y (north-south) first, and by X (west-east) second
sorted_features = sorted(features, key=get_centroid_coords, reverse=True)

print(f"Total features: {len(features)}")
print(f"Total features after sorting: {len(sorted_features)}")


# Create and export each chunk
for i in range(0, total_features, chunk_size):
    chunk_number = i // chunk_size + 1
    print(f"\nProcessing chunk {chunk_number}...")

    # Create a memory layer for the chunk
    sub_layer = QgsVectorLayer(f"MultiPolygonZ?crs={layer.crs().authid()}",
                                f"chunk_{chunk_number}", "memory")
    geom_type = sub_layer.geometryType()
    print(f"Sub layer geometry type: {geom_type}")
    print(f"Sub layer geometry WKB type: {sub_layer.wkbType()}")
    print(f"Sub layer geometry type: {QgsWkbTypes.displayString(sub_layer.wkbType())}")
    print(f"Sub layer CRS: {sub_layer.crs().authid()}")

    sub_layer_data = sub_layer.dataProvider()

    # Add fields and features to the memory layer
    sub_layer_data.addAttributes(layer.fields())
    sub_layer.updateFields()
    sub_features = sorted_features[i:i + chunk_size]


    # Check if the chunk has valid features
    if not sub_features:
        print(f"Chunk {chunk_number} is empty. Skipping export.")
        continue
    print(f"Chunk {chunk_number}: Extracted {len(sub_features)} features.")

    success = sub_layer_data.addFeatures(sub_features)
    if not success:
        print(f"Warning: Some features could not be added to chunk {chunk_number}.")

    sub_layer.updateExtents()

    for feature in sub_features:
        if not feature.geometry().isGeosValid():
            print(f"Invalid geometry detected in feature ID: {feature.id()}")

    if not sub_layer.isValid():
        print(f"Error: Input layer {sub_layer.name()} is invalid.")
        break

    # Reproject the chunk to EPSG:4326
    try:
        print(f"Reprojecting chunk {chunk_number} to EPSG:4326...")
        reprojected_layer = processing.run(
            "native:reprojectlayer",
            {
                'INPUT': sub_layer,
                'TARGET_CRS': target_crs,
                'OUTPUT': 'memory:'  # Use an in-memory layer for efficiency
            }
        )['OUTPUT']
        print(f"Reprojection successful for chunk {chunk_number}.")

    except QgsProcessingException as e:
        print(f"Error during reprojection of chunk {chunk_number}: {e}")
        raise  # Stop execution if reprojection fails

    # Get the extent of the reprojected chunk (in lat/lon)
    reprojected_layer.updateExtents()
    extent = reprojected_layer.extent()
    chunk_extents.append({
        "chunk": chunk_number,
        "features": len(sub_features),
        "min_lon": extent.xMinimum(),
        "min_lat": extent.yMinimum(),
        "max_lon": extent.xMaximum(),
        "max_lat": extent.yMaximum(),
    })
    print(f"Repo Layer CRS: {reprojected_layer.crs().authid()}")
    print(f"Repo Layer Chunk {chunk_number} extent: "
          f"Min Lon {extent.xMinimum()}, Min Lat {extent.yMinimum()}, "
          f"Max Lon {extent.xMaximum()}, Max Lat {extent.yMaximum()}")

    # Define the output path for the GeoJSON
    output_path = os.path.join(output_dir, f"chunk_{chunk_number}.geojson")
    print(f"Exporting chunk {chunk_number} to: {output_path}")

    # Export the reprojected chunk as GeoJSON
    error = QgsVectorFileWriter.writeAsVectorFormat(
        reprojected_layer, output_path, "UTF-8", reprojected_layer.crs(), "GeoJSON"
    )

    # Check for export errors
    if error == QgsVectorFileWriter.NoError:
        print(f"Successfully exported chunk {chunk_number}.")
    else:
        print(f"Error exporting chunk {chunk_number}: ({error})")

# Print all chunk extents in CSV format at the end
print("\nCSV Output of Chunk Extents:")
print("chunk,feature_count,min_lon,min_lat,max_lon,max_lat,url")
for extent in chunk_extents:
    min_lon = extent['min_lon']
    min_lat = extent['min_lat']
    max_lon = extent['max_lon']
    max_lat = extent['max_lat']
    f_count = extent['features']

    # Create the OSM URL for the bounding box
    osm_url = f"https://www.openstreetmap.org/?minlon={min_lon}&minlat={min_lat}&maxlon={max_lon}&maxlat={max_lat}"

    # Print the CSV row with the OSM URL
    print(f"{extent['chunk']},{f_count},{min_lon},{min_lat},{max_lon},{max_lat},{osm_url}")

print("\nAll chunks processed.")
|
Dedicated Import Account
Will use hamiltont_nova_Import
Changeset Tags
source=VGIN
Import Status Per Upload Chunk
Note: Per the DWG's advice, import is paused until 1 Nov to allow a longer period for pre-import review
| Status | chunk | feature_count | min_lon | min_lat | max_lon | max_lat |
| DONE - 21 Oct | 1 | 1000 | -78.35550324 | 39.38628836 | -78.23639107 | 39.45100915 |
| DONE - 22 Oct | 2 | 1000 | -78.36486372 | 39.3562779 | -78.18446043 | 39.38701276 |
| DONE - 22 Oct | 3 | 1000 | -78.36232016 | 39.33417316 | -78.14383743 | 39.35820365 |
| DONE - 22 Oct | 4 | 1000 | -78.35916379 | 39.31658864 | -78.12153098 | 39.33574577 |
| DONE - 22 Oct | 5 | 1000 | -78.36629139 | 39.3037176 | -78.09449648 | 39.31896178 |
| 6 | 1000 | -78.38055957 | 39.29479093 | -78.08685682 | 39.30619942 | |
| 7 | 1000 | -78.38631535 | 39.28951937 | -78.07920111 | 39.29772042 | |
| 8 | 1000 | -78.39133519 | 39.28177215 | -78.0662739 | 39.29207375 | |
| 9 | 1000 | -78.3987386 | 39.27463163 | -78.06035894 | 39.28536153 | |
| 10 | 1000 | -78.40381729 | 39.26752527 | -78.03916332 | 39.27742435 | |
| 11 | 1000 | -78.41157923 | 39.25928657 | -78.03517969 | 39.27121217 | |
| 12 | 1000 | -78.41559956 | 39.25383288 | -78.03824747 | 39.26291478 | |
| 13 | 1000 | -78.41657955 | 39.24732356 | -78.04050137 | 39.25756661 | |
| 14 | 1000 | -78.40125911 | 39.24054574 | -78.04188646 | 39.25089048 | |
| 15 | 1000 | -78.40427716 | 39.23522245 | -78.0471561 | 39.24374494 | |
| 16 | 1000 | -78.40464456 | 39.23107838 | -78.04942125 | 39.23890116 | |
| 17 | 1000 | -78.40776549 | 39.22584345 | -78.05139517 | 39.23474042 | |
| 18 | 1000 | -78.40998346 | 39.22219806 | -78.06075301 | 39.22901605 | |
| 19 | 1000 | -78.41528008 | 39.2164628 | -78.06367693 | 39.22534856 | |
| 20 | 1000 | -78.42096011 | 39.21052094 | -78.06494283 | 39.219668 | |
| 21 | 1000 | -78.42473085 | 39.20592805 | -78.06986175 | 39.21303849 | |
| 22 | 1000 | -78.43014612 | 39.20236712 | -78.07478176 | 39.20929534 | |
| 23 | 1000 | -78.43456088 | 39.19701165 | -78.07067478 | 39.20613869 | |
| 24 | 1000 | -78.43175999 | 39.19387641 | -78.07350933 | 39.20002774 | |
| 25 | 1000 | -78.43348559 | 39.1913623 | -78.07545182 | 39.19740007 | |
| 26 | 1000 | -78.4186674 | 39.18919444 | -78.07826241 | 39.19459834 | |
| 27 | 1000 | -78.42187212 | 39.1864137 | -78.0770293 | 39.19213158 | |
| 28 | 1000 | -78.42841321 | 39.18311966 | -78.08173155 | 39.18942092 | |
| 29 | 1000 | -78.42754527 | 39.18068565 | -78.08206382 | 39.18618401 | |
| 30 | 1000 | -78.42706656 | 39.17835389 | -78.07515185 | 39.18413886 | |
| 31 | 1000 | -78.42378204 | 39.17518108 | -78.07536611 | 39.18191237 | |
| 32 | 1000 | -78.41485794 | 39.17242027 | -78.08691814 | 39.17857648 | |
| 33 | 1000 | -78.40855336 | 39.16907011 | -78.09038342 | 39.17512478 | |
| 34 | 1000 | -78.39771669 | 39.16527983 | -78.08833045 | 39.171926 | |
| 35 | 1000 | -78.4024012 | 39.16260584 | -78.08885609 | 39.1682223 | |
| 36 | 1000 | -78.40672575 | 39.15993417 | -78.08985429 | 39.16547766 | |
| 37 | 1000 | -78.40149198 | 39.15621413 | -78.08337495 | 39.16317633 | |
| 38 | 1000 | -78.4110847 | 39.14899646 | -78.09153487 | 39.15917937 | |
| 39 | 1000 | -78.41869993 | 39.14237712 | -78.09006146 | 39.15214547 | |
| 40 | 1000 | -78.42307718 | 39.13745269 | -78.09737781 | 39.14529157 | |
| 41 | 1000 | -78.42532803 | 39.1319263 | -78.10509044 | 39.14020876 | |
| 42 | 1000 | -78.43563655 | 39.12425453 | -78.10133758 | 39.13509912 | |
| 43 | 1000 | -78.45183931 | 39.11290444 | -78.10374787 | 39.12714409 | |
| 44 | 1000 | -78.46382574 | 39.10687765 | -78.10302921 | 39.11587823 | |
| 45 | 1000 | -78.47360731 | 39.1031298 | -78.10369237 | 39.11056484 | |
| 46 | 1000 | -78.4815121 | 39.09818099 | -78.11132441 | 39.10652915 | |
| 47 | 1000 | -78.49514054 | 39.09403615 | -78.10945963 | 39.10155333 | |
| 48 | 1000 | -78.49243737 | 39.0912623 | -78.11494465 | 39.09755431 | |
| 49 | 1000 | -78.49470675 | 39.08852621 | -78.12385917 | 39.09481076 | |
| 50 | 1000 | -78.49655629 | 39.0862345 | -78.13055767 | 39.0916529 | |
| 51 | 1000 | -78.45415932 | 39.08328985 | -78.12936486 | 39.0891412 | |
| 52 | 1000 | -78.45451099 | 39.07911906 | -78.14002908 | 39.08642785 | |
| 53 | 1000 | -78.5019145 | 39.07350801 | -78.13474757 | 39.08227542 | |
| 54 | 1000 | -78.45918014 | 39.06751839 | -78.13963556 | 39.07685453 | |
| 55 | 1000 | -78.47642295 | 39.06092414 | -78.14172856 | 39.07071946 | |
| 56 | 1000 | -78.47197529 | 39.04863938 | -78.14559808 | 39.06324825 | |
| 57 | 1000 | -78.49549195 | 39.03490493 | -78.1502462 | 39.05147232 | |
| 58 | 1000 | -78.48602808 | 39.02662178 | -78.15381819 | 39.03809128 | |
| 59 | 1000 | -78.31411696 | 39.01393555 | -78.16297631 | 39.02796566 | |
| 60 | 69 | -78.31451995 | 39.00698526 | -78.22753749 | 39.01466277 |
QA
Green is OSM, Burgundy (or bright red) is to-be-added from VGIN
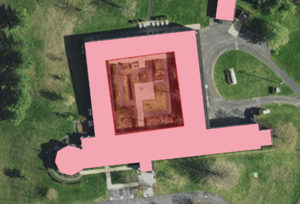
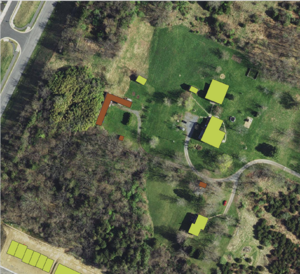
Example 1: Old Robert E. Aylor Middle School
The main school building (green) was added to OSM in Jan 2023. The covered walkways and equipment sheds (red) are not present on OSM
Existing Aerial Imagery status
Looking at existing imagery gives a good example of how VBMP is one of the best options for this region. As a reminder, "Clarity" imagery is not time-based it uses a mix of time ranges to ensure the best possible resolution.
Main Building Only: NAIP, Bing, USGS
Construction Shown: Esri, MapBox
All Buildings Done: VBMP, Esri Clarity
Example 2: Headley's Antiques
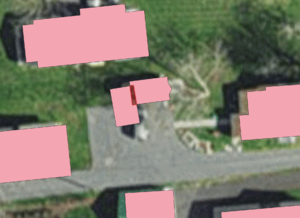
Rural business building missing from OSM. As VBMP imagery was collected in winter, we can also see two sheds which are not visible in any other imagery. Bottom-left shows OSM-present data (new buildings added by me) that are not yet shown in VBMP dataset as the construction was completed after VBMP aerial imagery.
Example 3: Pack Horse Road
Remote rural homes - completely unmapped on OSM. Adding these is critical for emergency response. Use 'Esri Clarity' maps to see houses in ID editor
Note: For better visibility, VGIN data is yellow in this image
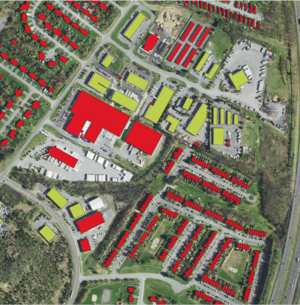
Example 4: North Winchester Industrial District
Urban region within the Winchester VA beltway of I-81 and VA-37. Mix of industrial and row homes. We see that OSM only has major industrial centers mapped, no one has yet traced smaller buildings. In most cases, the VGIN dataset is of high enough quality that it contains distinct polygons for individual residences in a unified townhome/row house building
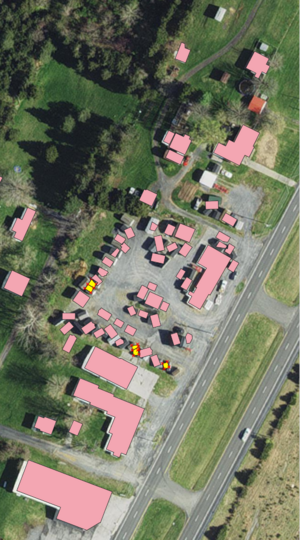
Example 5: Valley Structures
Note: This is BEFORE the Data Prep Step "Removal of tiny polygons". Post removal none of the small sheds shown here are in the data
Valley Structures is a local shed retailer. These for-sale shed structures are moved regularly while in the sale lot - a human would likely compare different imagery datasets and determine which buildings are permanent and ignore the for-sale structures. This import instead would (incorrectly IMO) load in the for-sale sheds as buildings. It would also (correctly) load the permanent structures into OSM. Note: Once the for-sale structures are in someone's back yard we WOULD like them classified as buildings, which is a distinction a human would likely make easily. See also: Shenandoah Sheds, LLC - 1518 Fairfax Pike, White Post, VA 22663 for a similar issue. I've fixed 3-4 of these in the dataset
Example 6: Comparison of Bing & VBMP
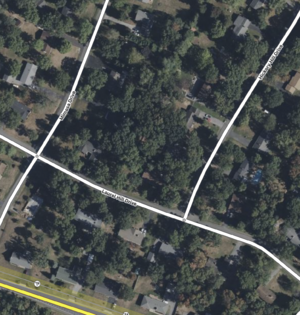
One major positive is that VBMP imagery for Frederick County was collected in winter after the leaves have fallen but before snow.
This makes it by far the best imagery for aerial tracing, as many structures are readily visible that are hidden by greenery on all other imagery I can locate.
