Heat maps
Jump to navigation
Jump to search
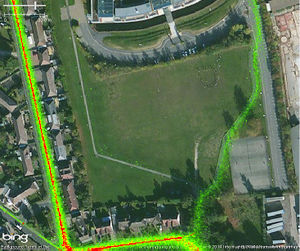
A heat map (or heatmap) is a 2-dimensional data visualization technique that represents the magnitude of individual values within a dataset as a color. The variation in color may be by hue or intensity.
- OSM Heat Map (aka Where did you contribute?) - A Pascal Neis tool that shows a user edits in a “Heat-Map-Overlay”.[1]
- Strava's Global Heatmap - A heat map by Strava that can be used for mapping. Two browser extensions are available for this purpose.
- Tah-heatmap - A renderer that renders a
4096 x 4096PNG image of the world with each pixel corresponding to one z12 tile. - QLever petrimaps - If a QLever query inlcudes geometry data, is possible to visualize the data in a heat map.
- Overpass Ultra - Data can be visualized in a heatmap in Overpass Ultra using Mapbox/Maplibre style.[2]
- uMap - In uMap, "Heatmap" is a type of layer.[3]
- OpenStreetMap Notes Heatmap - OpenStreetMap Notes Heatmap shows the notes density in a heatmap, with links to other tools.
- Osmose - Osmose has a layer called "Osmose Issues Heatmap".
References
- ↑ “Your OSM Heat Map” (aka Where did you contribute?) - neis-one.org, 14 aug 2011
- ↑ Overpass Ultra & MapLibre: Heatmaps - geoobserver.wordpress.com, 23 feb 2024
- ↑ Heatmap made easy with uMap - ybon's Diary, 21 apr 2014
