ohsome quality analyst
HeiGIT • Openrouteservice • Ohsome
Ohsome API • OSHDB • Ohsome Dashboard • OhsomeHeX • Ohsome quality analyst
| ohsome quality analyst | ||||||||||||||||||||
|---|---|---|---|---|---|---|---|---|---|---|---|---|---|---|---|---|---|---|---|---|
| Author: | HeiGIT | |||||||||||||||||||
| License: | GNU AGPL v3 | |||||||||||||||||||
| Version: | 0.15.0 | |||||||||||||||||||
| Website: | https://api.quality.ohsome.org/ | |||||||||||||||||||
| Source code: | https://github.com/giscience/ohsome-quality-analyst | |||||||||||||||||||
| Programming language: | Python | |||||||||||||||||||
| ||||||||||||||||||||
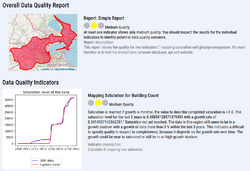
The ohsome quality analyst (OQT) is a software developed by Heidelberg Institute for Geoinformation Technology (HeiGIT) and based on the ohsome platform. Its main purpose is to compute and provide quality estimations of OpenStreetMap (OSM) data. OQT aims at providing this for diverse range of users such as humanitarian organizations, public administrations, as well as researchers or any other institution or party interested. The main task is to support the answer to the question “Is the OSM data good enough for my specific use case and within my area of interest?”. For doing so OQT provides a variety of indicators with a traffic light system with green-yellow-red as pointer.
Indicators
The basis of the quality estimation are the indicators. There are intrinsic indicators (using OSM data only) like the POI density, or the mapping saturation of buildings (looking at the development over time and if some saturation can be detected), as well as extrinsic indicators, which are using OSM data together with other data sources like the Global Human Settlement Layer population (GHS-POP).
Reports
The combination of a set of indicators is called a report in the OQT. To get fitting reports for different use cases the respective indicators are weighted individually and adjusted to results of research groups.
Usage
Website
The website serves as a simple entry point to the OQT. There reports with pre-computed indicators can be accessed for a selection of regions made by the OQT team. Currently it is not possible to upload custom areas-of-interest (AOIs) and compute report or indicators for those.
API
The OQT API offers the most flexible way to request quality estimations from OQT. It is possible to request pre-computed indicators for a selection of regions made by the OQT team as well as for your own areas-of-interest (GeoJSON). The API will return a GeoJSON Feature. This GeoJSON will preserve both the 'geometry' and 'property' field of the input GeoJSON Feature. The data and results of a computed indicator are written to the 'properties' field of the resulting GeoJSON Feature.
For more information check out the interactive documentation and examples using Python and Jupyter Notebooks.
CLI
It is also possible to set up OQT on your local machine and use the provided CLI. This is the most flexible way but some technical knowledge is required to set it up. For now please refer to the development setup documentation on how to set up OQT locally on your machine. After installation of the `ohsome_quality_analyst` Python package run `oqt --help` for documentation about the CLI.
See also
References
More information can be found here:
- Blog posts: https://heigit.org/tag/oqt-en
- Source code on GitHub: https://github.com/GIScience/ohsome-quality-analyst
Papers related to the ohsome quality analyst:
- Auer, Michael; Eckle, Melanie; Fendrich, Sascha; Kowatsch, Fabian; Loos, Lukas; Marx, Sabrina; Raifer, Martin; Schott, Moritz; Troilo, Rafael; Zipf, Alexander (2018): Ohsome – eine Plattform zur Analyse raumzeitlicher Entwicklungen von OpenStreetMap-Daten für intrinsische Qualitätsbewertungen. AGIT ‒ Journal für Angewandte Geoinformatik, 4-2018, S. 162-167.
- Auer, Michael; Eckle, Melanie; Fendrich, Sascha; Griesbaum, Luisa; Kowatsch, Fabian; Marx, Sabrina; Raifer, Martin; Schott, Moritz; Troilo, Rafael; Zipf, Alexander (2018): Towards Using the Potential of OpenStreetMap History for Disaster Activation Monitoring. Conference: Proceedings of the 15th ISCRAM Conference – Rochester, NY, USA May 2018, at: Rochester.

