User:Randomjunk
| I don't give a flying monkey's for tag voting, automatic changebots, endless discussions, categories, or any of that crap, but prefer to get on and actually do stuff. |
OpenStreetMap isn't a computer project, it's an outdoors activity.
Less of the bulk imports and wikifiddling please.
Go outside and map!

I support OSM by being a
member of the
OpenStreetMap Foundation
Do you?
I support the license
upgrade to ODbL v 1.0
My OSM user is randomjunk.
Cycle Map
I'm helping Andy out with his cycle map. He uses my machine to render the tiles.
GPS points
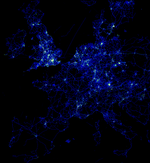
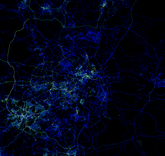
I thrashed the OSM DB server for a while last week, and produced some interesting images of the GPS points that people have uploaded to OSM.
It would be a bit tricky to do anything for a larger area because of the difficulty in obtaining these points. The European image contains 115 million GPS points, and I had to make more than a few thousand queries to the DB to get them (spread over about 24 hours though). It would be useful to have a "Planet.gpx"... but most of the time I can't imagine it would be any use... just the odd pretty picture.
The code to render these images works by building a 2D frequency array of points and then scaling each point against the 95th percentile point to generate the image. It's a complete hack script, and I haven't tried to tidy it up at all. To run it do:
python renderPoints.py <gps_file> <width> <imagename> [<bbox>]
If you don't supply a bbox then the program will make two scans of the gps file -- the first calculates the extent. The GPS file is a simple file containing a point on each line, each point being two floating point numbers separated by a tab. The file can be gzipped.
Post codes
Using the data from npe-maps and free the postcode, I created a slippy map showing the rough postcode area polygons that the data implies.
The code for this is on the page. The tiles are rendered using Mapnik.
Multi country
I was playing with rendering differently for different countries.
This is really simple.
- take the world boundaries shape file used by the mapnik slippy map
- import them into postgres
- use the postgis functions to split the boundaries into tiles (this improves efficiency for the next step)
- for every OSM line use the postgis functions to figure out which country the line intersects with... if matches multiple then just pick the first
It has some problems:
- the boundary polygons aren't super accurate... we've been using them for border plotting on low zoom though so they're not that bad.
- the Mapnik style files become completely impossible to edit... you have to add country conditions into every rule, and if you want a default style it has to explicitly exclude all the other countries you've used (I haven't done this in the above example render and you can see the problem... maybe possible to fix this in the SQL -- would need to basically create a table for each country. The alternative is to improve Mapnik's file format.
Progress
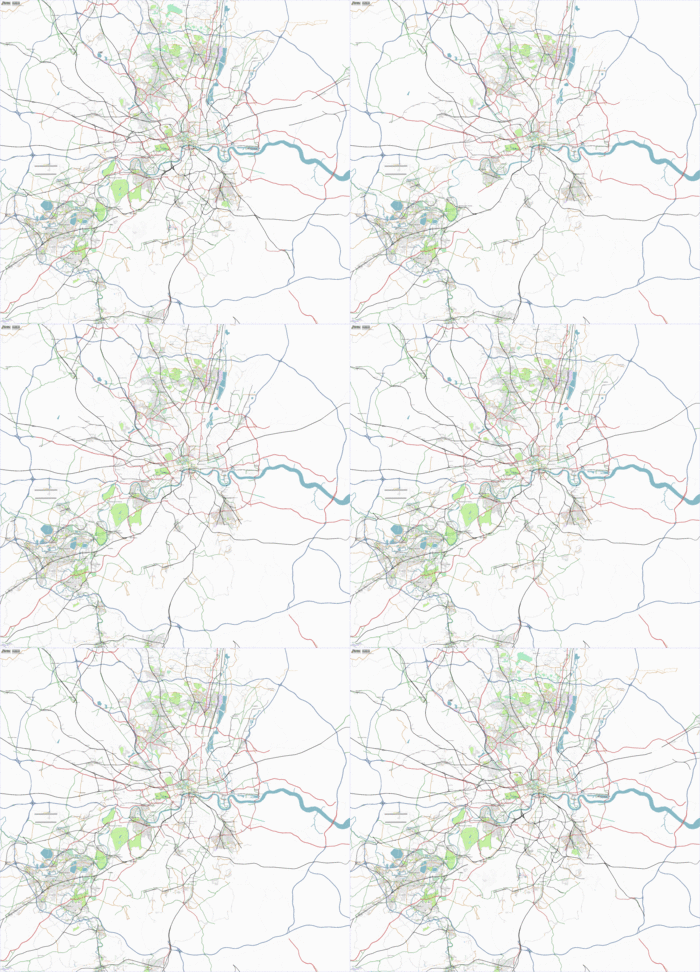
I'm currently creating every week some over view plots of various areas to demonstrate progress in OSM.
These used to be rendered using Osmarender (for the London one.. I wasn't doing the others) but unfortunately that method suffers from an exponential increase in time and memory usage as the size of OSM data increases. When the Greater London .svg file topped 250MB everything broke.
So now I'm using Mapnik. The process is:
- download the planet every week
- import using osm2pgsql
- use generate_image.py with a modified osm.xml style file
This process is approximately linear with the planet size (possibly n log n... haven't really thought about it much) -- most of the time is spent importing the planet (about 5 hours). Anyway it renders the entire USA in about 5 minutes... so it's not slow once the data is imported.
Osmarender way
For anybody interested in how File:LondonProgress.gif was rendered (and hence the above animation), get ready to be scared to death by the hackery:
First off the data is grabbed using the following python script which downloads it bit by bit in "tiles". It's done like this so as not to stress the OSM server too much by requesting large areas (areas this big aren't allowed anyway), and to spread the requests out over an hour or two too. I'd use the planet file except that it wasn't very reliable at the time I started this, and it seemed a bit pointless downloading 350MB for just a tiny lump of it.
import urllib
import time
import os

trlon=0.291137
trlat=51.73723
bllon=-0.57678
bllat=51.23096

lat=bllat
lon=bllon

while lat < trlat:
	while lon < trlon:
		print "getting %f,%f" % (lat, lon)
		if os.path.exists('map%f_%f.osm' % (lon, lat)):
			print "skipping as file present"
		else:
			data = urllib.urlopen('http://<osmid>:<password>@www.openstreetmap.org/api/0.3/map?bbox=%f,%f,%f,%f' % (lon,lat,(lon+0.035),(lat+0.035))).read()
			f = open('map%f_%f.osm' % (lon, lat), 'w')
			f.write(data)
			f.close()
			print "retrieved data, sleeping to not pound OSM too much at once"
			time.sleep(10)
		lon += 0.035
	lat += 0.035
	lon = bllon
Then all the "tiles" are stuck together. This is the dirty bit! (footer and header are just files containing an XML OSM file start and end, the awk is there to strip the <bounds> elements the api now puts in):
cat header > combined
for f in *.osm
do
  awk '!/<bounds/ {print}' $f | tail --lines=+3 $f | head --lines=-1 >> combined
done
cat footer >> combined
mv combined osmarender/data.osm
The data.osm file is 35MB for this area.
I then used xsltproc to do the render to SVG using a standard osmarender rules file, but I did modify it to make the tube lines show up better, and to turn on segments painting. The resulting SVG is 63MB... a bit huge, and takes a good half hour and most of the RAM in my box to do.
I then used rsvg to render the SVG to PNG specifying the width as 1280 pixels. This takes just a couple of minutes, and only uses a moderately stupid amount of RAM to achieve.
I've been doing this once a week since mid October 2006, you can see the results of this here.
At the current growth rate of done areas I'm going to run out of RAM in about 6 months :-( ... yup.. run out of RAM... rethink required: going with Mapnik -- see above.


