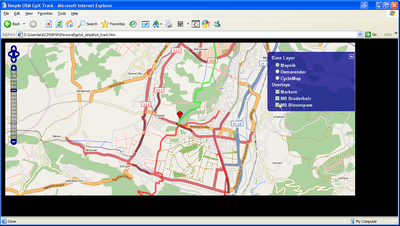
Openlayers Track example
This example show you how to display one or multiple GPX Tracks in an OpenLayers map.
This example is based on the OpenLayers Simple Example.
Instructions
Requirements
- Track as a .gpx file
- Text editor (such as Notepad, or any other text editor)
- Webbrowser (Firefox, Internet Explorer, ..)
- Access to a Webserver (but see below for solutions)
- 3 minutes of your time :-)
Steps
- Place the gpx file(s) into a folder on the webserver
- Create the following HTML file (also on the webserver):
<html>
<head>
	<!-- Source: https://wiki.openstreetmap.org/wiki/Openlayers_Track_example -->
	<title>Simple OSM GPX Track</title>
	<!-- bring in the OpenLayers javascript library
		 (here we bring it from the remote site, but you could
		 easily serve up this javascript yourself) -->
	<script src="http://www.openlayers.org/api/OpenLayers.js"></script>
	<!-- bring in the OpenStreetMap OpenLayers layers.
		 Using this hosted file will make sure we are kept up
		 to date with any necessary changes -->
	<script src="https://www.openstreetmap.org/openlayers/OpenStreetMap.js"></script>

	<script type="text/javascript">

		var map; //complex object of type OpenLayers.Map

		function init() {
			map = new OpenLayers.Map ("map", {
				controls:[
					new OpenLayers.Control.Navigation(),
					new OpenLayers.Control.PanZoomBar(),
					new OpenLayers.Control.LayerSwitcher(),
					new OpenLayers.Control.Attribution()],
				maxExtent: new OpenLayers.Bounds(-20037508.34,-20037508.34,20037508.34,20037508.34),
				maxResolution: 156543.0399,
				numZoomLevels: 19,
				units: 'm',
				projection: new OpenLayers.Projection("EPSG:900913"),
				displayProjection: new OpenLayers.Projection("EPSG:4326")
			} );

			// Define the map layer
			// Here we use a predefined layer that will be kept up to date with URL changes
			layerMapnik = new OpenLayers.Layer.OSM.Mapnik("Mapnik");
			map.addLayer(layerMapnik);
			layerCycleMap = new OpenLayers.Layer.OSM.CycleMap("CycleMap");
			map.addLayer(layerCycleMap);
			layerMarkers = new OpenLayers.Layer.Markers("Markers");
			map.addLayer(layerMarkers);

			// Add the Layer with the GPX Track
			var lgpx = new OpenLayers.Layer.Vector("Lakeside cycle ride", {
				strategies: [new OpenLayers.Strategy.Fixed()],
				protocol: new OpenLayers.Protocol.HTTP({
					url: "around_lake.gpx",
					format: new OpenLayers.Format.GPX()
				}),
				style: {strokeColor: "green", strokeWidth: 5, strokeOpacity: 0.5},
				projection: new OpenLayers.Projection("EPSG:4326")
			});
			map.addLayer(lgpx);

			// Add a Layer with Marker
			var size = new OpenLayers.Size(21, 25);
			var offset = new OpenLayers.Pixel(-(size.w/2), -size.h);
			var icon = new OpenLayers.Icon('https://www.openstreetmap.org/openlayers/img/marker.png',size,offset);
			layerMarkers.addMarker(new OpenLayers.Marker(lonLat,icon));

			// Start position for the map (hardcoded here for simplicity,
			// but maybe you want to get this from the URL params)
			var lat=47.496792;
			var lon=7.571726;
			var zoom=13;
			var lonLat = new OpenLayers.LonLat(lon, lat).transform(new OpenLayers.Projection("EPSG:4326"), map.getProjectionObject());
			map.setCenter(lonLat, zoom);
		}
	</script>

</head>
<!-- body.onload is called once the page is loaded (call the 'init' function) -->
<body onload="init();">
	<!-- define a DIV into which the map will appear. Make it take up the whole window -->
	<div style="width:90%; height:90%" id="map"></div>
</body>
</html>
- Open the html file in a browser
Customization
If the basic example works in your web browser, you can go on to adapt the web page to your needs.
- Change the starting point and the map zoom
- open the html file in the text editor and change the following lines:
// Start position for the map (hardcoded here for simplicity
// but maybe you want to get this from the URL params)
var lat=47.496792;
var lon=7.571726;
var zoom=13;
- Change the track
- open the html file in the text editor and change the following lines:
// Add the Layer with GPX Track
var lgpx = new OpenLayers.Layer.Vector("Lakeside cycle ride", {
	strategies: [new OpenLayers.Strategy.Fixed()],
	protocol: new OpenLayers.Protocol.HTTP({
		url: "around_lake.gpx",
		format: new OpenLayers.Format.GPX()
	}),
	style: {strokeColor: "green", strokeWidth: 5, strokeOpacity: 0.5},
	projection: new OpenLayers.Projection("EPSG:4326")
});
map.addLayer(lgpx);
- Lakeside cycle ride is the name of the track, this is displayed in the Layer switcher.
- around_lake.gpx is the path to your GPX file on the server. NB you cannot call for a file from another domain.
- style: {strokeColor: "green", strokeWidth: 5, strokeOpacity: 0.5} these control how the track looks on the map. See the OpenLayers documentation for details of what can be configured here.
- If you would like to display more than one track, just copy these 2 lines and change the values again.
Common issues
Depending on the security settings, some web browsers (notably Internet Explorer and Google Chrome) may refuse to process JavaScript and/or load GPX files from disk in file://-type URLs, that is when your HTML file is accessed directly from your hard drive without a web server.
This may be circumvented by using a tiny, local HTTP server to access the files.
The Python programming language has a builtin web server which can be started by changing to the directory with the HTML files and then using the command
$ python -m http.server 8000 # for Python 3
$ python -m SimpleHTTPServer 8000 # for Python 2
Then the files can be accessed by opening httpː//localhostː8000/ in your web browser.
There are also small web server implementations available for Microsoft Windows, for example tinyserver [1], which can be used as standalone applications, without needing python.
| ||||||||||||||||||||||||||||||||||
